Monday, October 31, 2011

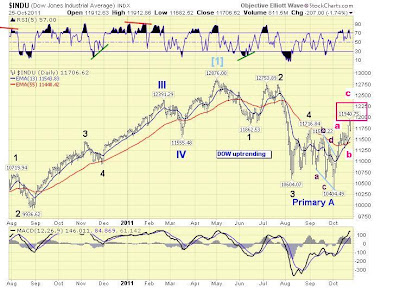
DOW possible peak update and Europe Warning 10-31-2011


U.S. Equities posted the Biggest Monthly gain since 1987. Real or trap? I believe its a trap, with a real good news it brings. I know U.S. is definitely doing good in terms of its "REAL" Earnings, the problem is still in Europe, if all banks/investors are taking 50% default on Greek Bonds, why is equities rallying? they want to take a 50% loss? I really dont understand what's wrong with them, Though this may be good in the long run, the 50% default is really a GOOD and Perfect decision, a sacrifice in the short term, to recover long term. But take note, LONG term, means a lot of years from now. Banks write downs effect earnings, investment funds goes down, maybe another Lehman-European Version could happen as well.

Now, lets focus on the short term trades, DOW is really overbought, this is a weekly chart, and a weekly chart with an Overbought RSI , means??? Correction is coming.

Also, try to focus on the MACD below, even though this is the biggest monthly rally since 1987, how come MACD just moved an inch to the 0 line, where the below 0 means Bearish Market. Look at what happened also last 2007 Primary Wave B correction, MACD went back to near 0, but eventually sold off.

Short Term, the 12200 for me already means the peak for daily,weekly timeframe. I vote for selloffs to 9000-10000 level until Q1 Q2 2012.

Also, for Europe Equities, Focus on these 2 major equities (Although both stands at 10 P/E Ratio, im split between confidence level and most of the pain they carry on their back), the rally seems so good, but the possible head and shoulder pattern is ruining my bullish conscience, I am really scared if these below happens - A double dip recession for Europe. Ceveat.

Thursday, October 27, 2011

warning: huge cross and weekly rsi very overbought 10-28-2011


Usually huge crosses means peak in the market. and now I have 1 thing to do. i will surely get out of the market and treat this as selling opportunity. goodluck and i hope that dow fut does not mess with the huge gains in asia today! ceveat.

Personal Disclosure at the end of the day:
I sold 25% of all my exposures to USD currency (biggest 1 day transaction in my entire trading history), and for PSE, nothing in bluechips went up, how did anyone able to sell? Except for EDC,banks, TEL and mining.

End of the day Portfolio Status:
PSE:
20% -equity
80% -cash

USD:
50% - cash
50% - equity (still stucked) and leaning towards to exit points

Wednesday, October 26, 2011

Almost there 10-25-2011


Our Very Own Market has rallied to 61.8% of its retracement in just 3 weeks time, ahead of schedule from our target time of 2months average.

With this kind of behavior, I remember certain rallies which are temporary on top of their 52 week highs, and never got a chance to stay their for weeks time. Even though this rally will go much higher or will be the end of Primary Wave B. Our own money making play can now be ended, as seen above( projected), compared to below(actual), we already achieved what we want to earn this is Bear Market Rally, or whatsoever you call it. its already 12% Gain. 12% Gain in 3 weeks time? Anyone should be happy, this is the strongest rally in 3 weeks time since 1991.


Before I end this Money Making Play of the Quarter posted last August. I still see U.S. able to rally back to 12800, but I put only 20% of that scenario to happen, 80% goes to the bearish doom and gloom scenario that its only a "haux rally", for big fund managers to exit the market.

Congratulations to those who followed! More power to our future money making plays. If the 80% Chance that markets will dip further in the following months, Money Making plays will be surely posted in this blog site. Enjoy!

PD: 10/24/2011 - out 25%
10/25/2011 - out 25%
remaining 50% im planning to get out VERY SOON.

Sunday, October 23, 2011

Bear Market Play of the quarter, peak be may seen soon 10-23-2011

We continue our Bear Market Play of the quarter, and those who followed on buying at 10700 level, is now at 10% gain.

We didnt expect this rally to be as fast as this, we are targeting 11750-12000 as the exit points, but looks like we already hit 11750 in just 3 weeks time, After this quick rally, is there a quick rally quick selloff and continuation of Bear Market? I believe so.

Wednesday is the probable deal date of Europe, and Today, on a weekend, Europe is having a meeting for their debts, people are optimistic on their discussions, but when nothing in particular is exciting to investors, selloffs may continue.

I put to end the Bear Market play of the Quarter, Sell around 11750-12000, and has a chance to hit as high as 12250 based on EW Calculations. This rally is so fast, that the possible end rate of Primary Wave B may be as early as next week, and the latest of around 3rd week Nov. 10% is already good enough for a 3 week gain. Play safe guys!

EW targets based on Primary Wave A :
PRimary Wave B: 0.50 of A = 11750
.618 of A = 11950
.7 of A = 12100

Saturday, October 15, 2011

HongKong, London, Germany, Australia, Korea indices 10-16-2011

Markets were in a rally mode, off from weekly losses, and I have put some resistance marks per Market Equity Index, and how how can It probably bounce to, before making new lows.


HSI Markets were the cheapest among all important Equity Indices around the world, with only 8x P/E Ratio, the drop to 16000 is a BUY BUY BUY!! Expect to rally at 19000-19500 the least, and 21000 the maximum.


London, the remaining ones who give hope to Europe nation, is for a possible enourmouse 15% rally from the lows, BUT, BUT a possible super huge head and shoulder pattern forming. Be wary, as this could be the another forecast to be seen happening in the near future. The rally to 5750 is an opportunity to get out, and maybe the right shoulder being formed.


Germany, the counterpart of London, is also bracing for a possible head and shoulder pattern, forming into the base, and same with London FTSE, a double dip target is attainable once HnS pattern is confirmed.

Australia Index, this market slows down due to heavy floods in Q1 and Q2, now in Q3, it returns back to GDP gains, expect AU trend to be under the large Black range, trade the range, and expect to rally around 4500-4650 before any downtrend occurs.


KOSPI, the K-Pop country, has made a positive divergence last week, coincidentally happened with the 10700 lows. This market gave a good signal for me to get into asian markets, and its very successful giving a good positive divergence for MACD and RSI.

Expect KOSPI to rally until 1900-2000.

All markets are in a corrective actions from the 20% losses globally for the past 4-5months, may these become so strong or weak, take it as a chance to lighten down, as ECB and Greece has no "good" and "recovery" plans yet, just last week, bad news grips Greece, with a bloating debts, and expanding loans.

Be safe and make sure to cash out profits.

Wednesday, October 12, 2011

PSE daily update 10-13-2011


And rally continues throughout our Bear Market Play of the Quarter.

For our very own PSE, It went off to huge rally back to its 4150 breakdown point, I am amazed how strong PSE is, but we aware, it might not be thaat strong as what you think, big players MAYBE or ABSOLUTELY just hitting things up, so they can get out of their huge portfolios, catching attention to bargain or noobies who dont know how to trade this market yet.

There were a lot of range trade plays through this Play equivalent for individual PSE stocks, some are:
BDO - 45 to 52
PNB - 45 to 52 as well
MPI - 2.7 - 3.0 (but this is risky because of high P/E ratio)
EDC - 5.4 to 5.8

and some other more.

At this point in time, while we expect DOW to calm down in days time, another rally should spike up to DOW and global markets, before a series of meltdown happens around end of Nov to early Jan.

My one an only tip = unload at the 4150-4180 resistance.. Or sell what you have bought at the 3700 level. Its a good 20% money making play already. Be aware, while this rally continues, We may encounter a false breakout to an intraday high of 42xx, but dont be attached to it. It may be a bull trap.

My Reason - I still follow and stick with the DOW forecast of after the Primary Wave B 1-2mos rally, another storm comes with a possible target low of 9000 for DOW. Better be safe than sorry. Gain is a gain.

Stay in cash is still the best strategy at this moment.

Personal Disclosures: 75% cash, and 25% equity, and planning to unload the remaining at the 4150-4180 resistance.

Sunday, October 9, 2011

DOW Update and Bear Market Play of the Quarter update 10-9-2011

Some updates to my last post regarding the Bear Market play of the Quarter (http://theamazingchart.blogspot.com/2011/08/bear-market-play-of-quarter-8-22-2011.html).

Last Aug 22,2011. We posted a 2 type scenario on the possible finding bottom of the Major Wave A correction of this Bear market. We forecasted that very soon, a possible short term bottom could happen, either a new low below 10700, or a failed formation of the 5th wave down of Major Wave A, with price target and Chart behavior indicated on the 1st attachment below. (this was 1.5months back then).

I hope everybody packed in equities for a roller coaster rally since the 10700 BUY target. I actually BOUGHT on that level, and got scared the day after when it had a "FALSE breakdown" having -300 pts on DOW after the 930am NYSE Opening Bell.


And comparing our Forecast 1.5months ago vs Current price. It exactly looks the same!!! We topnotched our forecast values and behavior of charts for the bottom buying. Charts are really Amazing. That's my real reason for naming my blog site. "TheAmazingChart".


I Managed to enter the 10700 level, and its already 7% net gain. There could be minor correction for oversold daily RSI, and is bracing for a net gain until 1-1.5months. On this usual Primary Wave B rally, no one can estimate the exact values, as sometimes, Bad news lessen the projection rally. I still set my target selling point of 11500-12000. I guess it will be hard to be back on the 12k level. Though thats a remarkable SELLING point with an estimate of 12% Net gain.

Overall, on elliot wave counting, it suggest we are really in a Bear Market, after the Primary Wave B rally. A projected Primary Wave C will have a minimum target of 9000. And 6500 if double dip happens. (70% chance to happen 9000 level,30% for a double dip).

Tuesday, October 4, 2011

The tide is too strong 10-4-2011


(THIS POST IS THE FALSE BREAKDOWN / FLUSH-OUT OF THE MARKET, we are now in an Uptrend Cycle and our Bear Market Play of the quarter continues)

The only way for our market to go up in the next few weeks is to climb up and bounce the 10650-10700 lows, and just now, 30mins after the start of the trading, looks like our Bear Market play of the Quarter became hazy.

At any scenario, Elliot Wave chart experts suggest a good rally before this selloff happens, But the tide is too strong, and no walls can give it a pause.

Now, looks like it broke down an important 10700 support, and enters BEAR Market territory, target projection is 9750-10000 as shown is the chart.

After it hits 9750-10000, a 1-2month rally can be seen (right shoulder), but may form the scary "Bear market head and shoulder pattern" which is larger than the usual, if it happens.... A double dip recession is standing by the side with a target downside of 6000, the year 2009 low. Hope it does not happen.

Sunday, October 2, 2011

Dow Jones and updates on the Bear Market Play of the Quarter 10-2-2011


GLobal Markets still became choppy, at least a 100 points movement daily. With this kind of market, Its good to trade the Pink range, but has a 70% chance that a breakdown below the 10700 support is likely to happen. But at this point in time, I believe, im going to bet on the 30% Chance that a little bit of upside will happen in the next weeks/months. I'll discuss it in our 2nd chart (money making play of the quarter).

Notice that in a Bear Market (likely what's happening now), MACD does not go up above the 0 level, or sometimes, goes to 0 level to finish some corrective rally, and then resume the downtrend. We expect this MACD to reach 0 level in weeks/months time. And I believe that there is calm first, before another storm comes.

REMEMBER: Greece Bonds has a deadline this Dec 2011 for the partial payment.


Last Aug 22, 2011 (
http://theamazingchart.blogspot.com/2011/08/bear-market-play-of-quarter-8-22-2011.html), I've made a quickplay that may happen in the Dow Jones. On my analysis, its following the 1st Scenario we had, which is the failed new low (5th wave of the Pimary Wave A). At this point in time, This play is still intact, and I assume some of you guys have bought in (10700 support) for a target of 11700-12000.

Even though this is 30% chance to happen (percentage acounts for the Insolvency of European Meetings).I believe, This is a money making play, and a chance for stucked people to get out of the market. If all places are according to our expected waves. We can have a good week rally until Early or Mid November. Meaning, choppy sessions will persist, but will have net gain on the target upside.

After that, all signals/technical indicator expect to have a new 52 week low in Months time.

If this bear market follows all the length and timing, we expect it to bottom around Q3 or Q4 2012, with a DOW target of 8000-10000 level. (still depends on the Wave structure of Primary Wave A and B).

Note: This is all about DOW Jones, PSE is completely different.

“It’s Going to Get a Lot Worse”: ECRI’s Achuthan Says New Recession Unavoidable By Aaron Task Daily Ticker 9-30-2011

Weakness in leading economic indicators has become so pervasive the Economic Cycle Research Institute now predicts a new recession is unavoidable.

"The vicious cycle is starting where lower sales, lower production, lower employment and lower income [leads] back to lower sales," co-founder Lakshman Achuthan declares in the accompanying video.

Whereas Achuthan said the jury is still out in late August, the weakness in leading economic indicators — and ECRI uses a dozen for the U.S. alone, he notes — has become a "contagion" that is spreading like "wildfire."

Although the recovery has been "subpar" by nearly every measure, Achuthan refutes the idea the economy never got out of recession in the first place. "Just because it looks and feels a certain way doesn't mean it's a recession," he says. "You haven't seen anything yet. It's going to get a lot worse."

It's too soon to predict just how bad it's going to get, but he expects another spike in unemployment and further expansion of the federal government's $1 trillion deficit. This forecast has huge ramifications for the 2012 election and the already struggling U.S. consumer and Achuthan says a "mild" recession is the best-case scenario.

By now you may be wondering what separates ECRI's recession call from the myriad other recession calls out there. First, ECRI's primary raison d'etre is predicting recession and recovery calls. Second, and more importantly, The Economist reports ECRI has never issued a "false alarm" on a recession call, meaning many of the Chicken Littles currently declaring "the sky is falling" might actually be right this time around.

Aaron Task is the host of The Daily Ticker. You can follow him on Twitter at @atask or email him at altask@yahoo.com