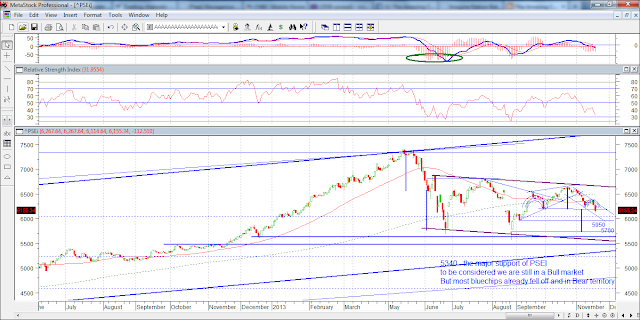
PSEi fell off a very important support(6200). Intra day it held above 6200 but sank down in the afternoon trading closing at 6150 - a clear indication that PSEi broke down again its important support.
Typhoon Yolanda destruction is one of the reason that sparked the selloff, but looking into our neighboring countries in Asia, Jakarta and Thailand - most of the top 5 countries that led the best for 2012 YTD, are almost -20% for the year. Completely the other way around against Germany and SPX at an estimate of +20% YTD.
Mid 2013, we have already plotted the sideways to down pattern for PSEi (dark red), and we still traded with high risk on selective stocks, I myself got stock on some of the stocks which made me think that, in this kind of market, investing in Equity Funds is better and has a lower risk.
Now that an inverted head and shoulder could have been triggered, a target of 5700 is in place, very far from our current index price right now. (50% chance).
Short term support is at 5950-6000 then to our 52week low near 5600-5700.
What I am scared of is that our PSEi index is still tagged in a Bull Market, for the reason of holding to its 4.5yr uptrend support sitting nearly at 5340. BUT, BUT, some blue chips hardly cannot rise and broke below their 4.5yr Bull Market channels, namely MBT FGEN LPZ and so on. Which could lead to new 52week lows in the coming weeks/months to come. Other bluechips analysis to follow..
Portfolio: 60% Equity - 40% Cash
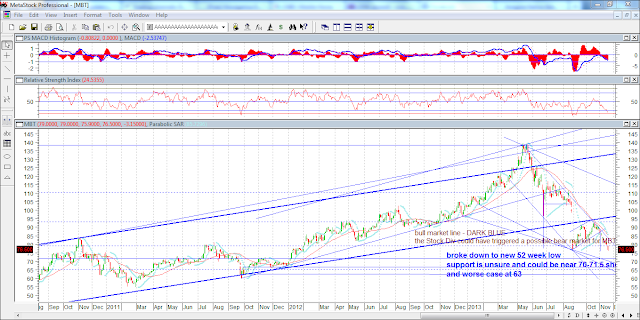
MBT - the first bluechip bank to fell off its important 4.5year uptrend, the stock dividend must be blamed for what has happened to this stock. Although fundamentally speaking, it might still be strong even after giving 30% stock dividend. In technical terms, a breakdown is a breakdown.
Attached above the chart of MBT, and dark blue channel I draw are usually the 4.5year uptrend lines, day by day, I see stocks break below their important uptrend lines causing more selloffs in the market.
I was catching MBT near 80 for the reason that a small uptrend channel is looking good, days later, it fell off easily and expected that 75.5 to 76.5 is a good support.
Today, 11/21/2013 AM trading, it fell off to a new 52week low. really very bad with a good fundamental of P/E 8.0
I really feel that no one(Local or Foreign) that supports these stocks which are in critical conditions. Sorry to say but these kinds of observations happen during a "Bear Market", letting stocks break below easily and reach 52 week lows.
Short term support at 70-71.5, and worse scenario at 63. (31.8% retracement of the entire 2009-2013 bull market)
FGEN and FPH blew up when typhoon Yolanda affected middle portion of the Philippines, bringing electrical posts down around the region.
FGEN was one of my best bet on range trades as it succeeded holding on to its 4.5year uptrend support last May 2013 and bounces from 16 to 19.
But recently, the storm killed this stock, making it clearly break down and fall into Bear Market territory. Freefall was seen from 16 to 13 in a matter of days and it is now trading at 12.xx
I cant believe that its running low (71.8% retracement of entire 2009-2013 bull market), no one knows when the freefall will stock, I also bought some of this around 13-13.5 for the reason that magnitude of breakdown is near that area, but seems that no support/buyer is willing to hold them, so I need to downgrade the support near 11 to 12.50 (very very near to its all time low at 9.xx)
Elliot Wave analysis shows that FGEN could be in a Major Wave 3 selloff of Primary Wave C bear market, and Major 4 and Major 5 upcoming before it can possibly bottom in a new low or in a flat pattern.


No comments:
Post a Comment