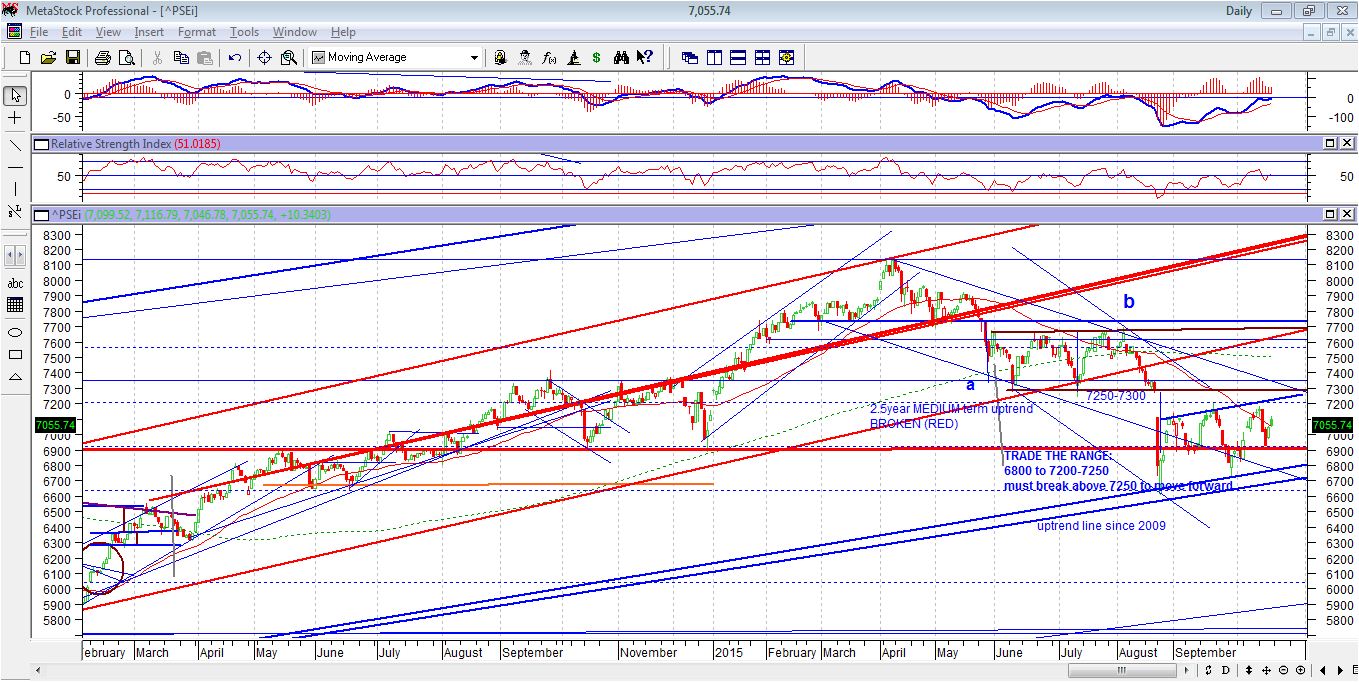
PSEi almost reached 6950 to 7000 bottom support, then bounced back high!
What are the foreigners thinking? Is it bluff/false breakdown or they just bought back what they sold? let me cut them by showing some Top 30 stocks
Some below did a CLEAR breakdown (break below support levels), and some within the day rallied above the level the support they broke, which what we call FALSE breakdown.
Some stocks below did not make it, some made the FALSE breakdown.
Which to follow? Let us see in the days to come, one thing is for sure, we may revisit 7500-7550 resistance level soon.
Showing posts with label PSEi. Show all posts
Friday, September 21, 2018
Saturday, August 25, 2018
[target 8700] IF Head and Shoulder Pattern confirmation on PSEi 8-26-2018
Thursday, June 21, 2018
[Bear Market Special] PSEi Philippines 6-21-2018
Short Term Chart
Updates from our trades:
We entered 7,550 last May 2018 which eventually broke out of the declining phase. PSEi rallied strong and reached 23.6% fibonacci retracement, a good bounce of 5% gain.
We had a target of 38.2% fibonacci around 8000 level to close our trade, but shit happens. Well it was still a nice trade since we avoided the 9000 to 7550 drop (19.2%).
From a good upward movement, PSEi broke down its decending channel and broke below its medium term support.
Until now, we do not execute any trades. The position we took last 7.550 was only around 10% Equity Portfolio and the BSP did not take any quick action with regards to the interest rate hike of US. Foreign firms continue to dump our PSE index and most probably shorting it. Yesterday's 0.25% interest rate hike in PHP is too late already to rescue our index.
In layman's term, don't catch the falling knives YET. Look for possible support.
Medium Term Chart:
Since the "NEWS" call this aka Bear Market. with the reason that market already corrected 20-25%. We can safe to say that we technical traders join them as they speak, as we broke below the 2009-2018 uptrend line.
Long Term Chart
Long Term Chart also shows that this dive can hit really hard.
1st minor support 7000-7100
2nd support at 6500-6600
3rd major support (38.2% fibonacci of 2009-2018 bull market) - 6000-6200
All I can say is that, from my 10years of trading, this is a good opportunity for us to learn that stock market do not go in 1 direction, they also experience the typical correction or at most a bearish case scenario.
I am not a bear, charts above show us that worse is yet to come, and we should prepare for it. As good entries lead to fruitful returns.
Strategy Tips for this medium to long term correction:
1. Look for entry points where foreign sellers stop or pause. (sideways pattern)
2. Try to wait for BSP to ease the USD to PHP (53.30 as of 6-21-2018), cheaper USD will lead to better PSE index.
3. Don't be afraid to invest in these times, patience is the key.
4. Collect as may cash as possible, so when a good entry point appears, invest 10-20% of your portfolio. Do not place ALL IN in a single trade.
5. Diversify.
* My own target: I am gladly welcoming 38.2% retracement (6000-6200) before trying to trade this market with these reasons:
1. PSEi is still around 19x PE ratio (expensive in Asia)
2. US (DOW and SPX) are still trading near all time highs, what more if they broke down as well
3. USDPHP should be around 50pesos or below to make investing in PSEi valuable again.
4. Bear Market correction lasts around 6mos to 2years.
5. Bull Market in the world is now at 9th Year.
** Rally anywhere from 7350-7550 is a SELL. Foreign companies will not come back soon I believe.
So be patient and live happy!
Tuesday, May 1, 2018
PSEi: Waiting for breakout or another leg down 5-1-2018
Entered when PSEi was 7550.
Looking for a breakout to sustain uptrend, or maybe another leg down,crossing fingers
Happy Labor Day!
Tuesday, April 17, 2018
Buying opportunity: PSEi 4-17-2018
Buying opportunity in PSEi
1. Closed at 77xx today, a good medium term support
2. Breakdown target 1:1 near 7550 level
3. Downtrend channel since Jan 2018 looks to end with a 5 wave down, could land and bounce with target support of 7500-7600
4. A clear reversal of downtrend to uptrend/sideways if we see a clear breakout pattern
Friday, April 13, 2018
Tuesday, April 3, 2018
Friday, April 1, 2016
Monday, March 14, 2016
Wednesday, March 9, 2016
PSEI: looks like a breakout after 5 waves down 3-10-2016
* my only concern is that. PH chart only shows breakout from all time high downtrend resistance VS all US, Europe and some Asia.
** SPX same downtrend resistance at 2034 for a clear breakout
Monday, February 8, 2016
PSEi resistance at 6700-6850 has been very tough 2-9-2016
Looks like PSEi resistance around 6700 (breakdown level) up to 6850 (downtrend resistance) will be very tough to beat.
Looking to cut losses at these levels when it hit these area last week.
US markets are very confusing, either:
1. higher low to make higher high than Jan
2. looking to make lower low vs Jan lows
Looking to cut losses at these levels when it hit these area last week.
US markets are very confusing, either:
1. higher low to make higher high than Jan
2. looking to make lower low vs Jan lows
Thursday, January 21, 2016
PSEi update 1-21-2016
PSEi lost 32% since peak of 8100 last 2015.
I was expecting a new high for the US, but the recent drop was so massive that all of Asia except Japan technically broke down from their Bull Market trendlines.
Wave counts in the US could have ended last night, and a "bear" rally could happen anytime soon. PSEi could even reach 6600 but technical traders may further sell on rally on recent news.
I have no plan to enter big time at this level, I know we are getting slightly cheaper valuation wise(17x PE), but seeing most Blue Chips getting killed from their 2009-2016 uptrend lines. Still recommending to further wait for US development.
Friday, January 15, 2016
PSEi full review. Bears could be taking over 1-16-2016
Recent happenings were sooo massive that medium/long term indicators were hit, and adjustments are necessary on our projections.
#1. (RED COLOR)
2.5year MEDIUM term uptrend broke down last Aug
- was still OK as market went sideways
#2. (BLUE COLOR)
6.5year LONG term uptrend broke down last week (Jan 6, 2016)
- THIS was an important event for 2016, when 6.5year bull MAY ended its peak last May 2015 at 8095 points.
- 6600 resistance will be the ultimate resistance to regain bullishless of PSEi
#3 (GREEN COLOR)
alternative 6.5year LONG term uptrend support at 6000
- this is just a plain alternative when drawing lines from 2007 peak to 2015 peak, and drawing parallel uptrend from 2009 bottom.
- NOT the main count right now, just a possible alternative LONG term uptrend line
2009-2016 (PROBABLE) ELLIOT WAVE count
- Since the start of 2009 Bull Market, I have been tracing the potential Elliot Wave count of PSEi, although no one is primarily using EW analysis on PSEi, I believe the concept of following counts can still be applied to PSEi.
- Primary V (April 2015) may already the peak of this Bull Market.
- US markets should still be the key EW count to follow and will post early next week.
CONCLUSIONS:
1. Technically speaking, after we break below 6600. PSEi's charts says we are probably in a Bear Market already
2. the 6000 alternative bull market support is just SPECULATIVE.
3. We should wait for EW count of US markets to give us clear idea.
4. 18x P/E for PSEi is still high (6450)
5. 6.5year bull market is longer than typical 4-5year average bull market
6. US just raised 25BSP interest rate, so historically speaking, everyone has no idea how to compare to century old US data where typical bull market peaks when interest rate gets too high.
7. No plans on trading the market, 15% equity portfolio got stuck last Dec. Cash is king.
8. Adjust as necessary, admit our mistakes, and learn from it.
CURRENT PORTFOLIO:
PESO:
30% equity/stocks, 70% cash
90% preferred shares, 10% cash
DOLLAR:
10% cash, 10% US Junk bonds, 80% PH Corporate Bonds
Goodluck!
Sunday, October 18, 2015
Wednesday, September 2, 2015
Wednesday, August 19, 2015
Thursday, August 13, 2015
Philippine PSEi, PSE traded in the US broke down 8-14-2015
Chinese Yuan develation caused global currencies to slide.
Philippine Peso devalued to 46.30 yesterday, from the lows of 44.50 last May 2015. Weaker Peso means weaker stock or equity inflows as well.
We noted that PSE may find a triple bottom near 7250-7300. But upon looking at PSE traded in NYSE, it broke down that triple bottom support.
It may look unusual since we are not there yet, 2weeks ago, it happened 100% same to TEL, NYSE's TEL managed to break down ahead of 2days. Imagine 2 days before PSE's TEL followed.
So I am waiting at the sideline for our local PSE's confirmation.
Jakarta - -20% from top
Thailand - -15% from top
Philippines - -8% from top
Subscribe to:
Posts (Atom)