Showing posts with label TEL. Show all posts
Monday, March 14, 2016
TEL: withrawal of Telstra boosted stock price 3-14-2016
Short term resistances: 2000-2150
Upgraded from Downtrend to Sideways pattern due to unexpected withrawal of Telstra and SMC venture. Boosting TEL and GLO's earnings to be on track for the next 3years.
Wednesday, March 9, 2016
TEL in bear market, looking for downside targets 3-10-2016
TEL still in Bear Market since we confirmed it late 2015.
And TEL gave up a lot of CASH dividend making foreigners drop this stock.
TEL still in long term Bear Market, but giving it hope by allocating BUY supports which could be around 1300-1500.
No assurance that it will rally, but a manageable support level to calculate its ROI in cash dividend and earnings.
For those who are stucked. I believe, TEL and GLO have already peaked it cycle in the next 5years or so.
Thursday, November 5, 2015
TEL: not looking good, entering Technical Bear Market 11-6-2015
2000 target is YR2011 lows
and 1850-1900 target is 2009 lows
With recent news that TEL's earnings disappoint, I believe GLO should selloff too. and GLO's values wayyy higher than TEL's 16x.
Another probable news is that SMC is joining the telcos offered in the Philippines, so good competition means less income.
We can't blame the performance of it's stock, since TEL is traded in the NYSE, and traders in NYSE are very sensitive to earnings.
Down are the days where we get 6-7% cash dividends from telcos. I am scared that we could retrace 38.2% or 50% since the 2003 rally(where price is just 300 per share).
Monday, October 26, 2015
Friday, October 9, 2015
Friday, October 2, 2015
PSE stocks below 30 RSI. AGI, ICT, LPZ, PNB, RCB, TEL 10-2-2015
Please take a quick look, and appreciate 5-10year charts of these PSE
stocks, most of them are technically in bear market territory. And are included in the Top30 PSE Index.

Tuesday, January 21, 2014
TEL and BDO joined the 'breakout' team 1-22-2014
TEL broke out from 2700 resistance and now in uptrend. Resistance short term is at 2800 then 2830, but I think it can go as high as 2900 if we remain strong. Ex-date and special dividend will be around March 2014 and we could go around 2800-2900 at the time of Ex-date.
BDO just broke out of 74 and now could be turning into uptrend. Initial uptrend resistance is 74.5 and increasing, we have a target of 78 medium term for the Dec2013 high.
PSEi still looking to hit 6100-6200 based on my initial targets, a sideways pattern for US can fuel PSEi to our initial target before any major move.
Cheers!
BDO just broke out of 74 and now could be turning into uptrend. Initial uptrend resistance is 74.5 and increasing, we have a target of 78 medium term for the Dec2013 high.
PSEi still looking to hit 6100-6200 based on my initial targets, a sideways pattern for US can fuel PSEi to our initial target before any major move.
Cheers!
Wednesday, January 8, 2014
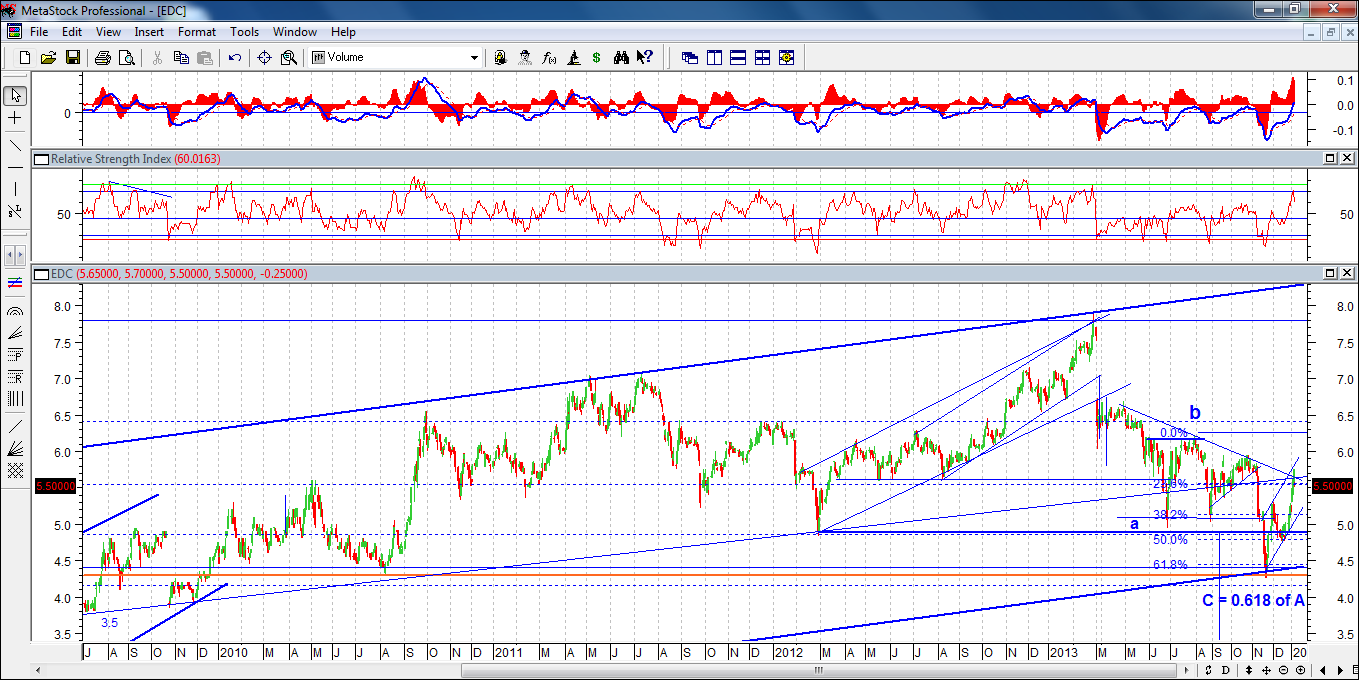
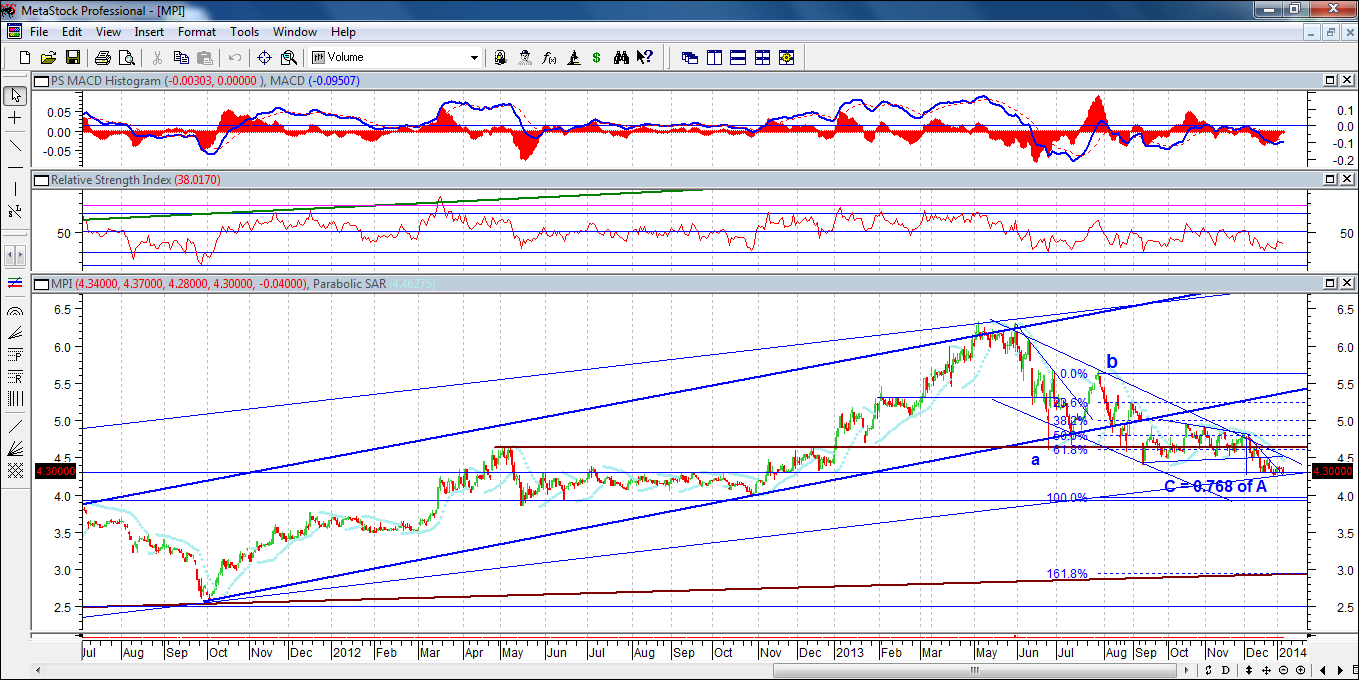
How amazing charts are! some PSE stocks may have bottomed, or forming a bottom 1-8-2014
(PSEi, LPZ, EDC,FLI,FGEN, FPH, MPI, TEL, SMPH, MWC)
This is why I love charts!
By combining Elliot Wave Theory and Fibonacci Retracements and Projections, we can clearly dissect down charts and see how emotions could lead to something and how we can forecast and make use of other people's emotions to predict stock market!
Although things might not be in shape yet, I myself is having some technical indicators that bottom for some stocks could be possibly in the works or have bottomed already.
I am anticipating a double digit correction in the U.S. soon, but locally speaking(PSEi)- if and only if U.S. extended its gains in a month maybe, we may see good chance to revisit 6100-6200 first before anything else.
I made below retracement targets of "possible" Primary Wave IV.
The usual sequence: Major wave A, then a rally to Major wave B before a final decline to Major wave C to finish any wave II or IV correction.
Please take a look and share how brilliant charts are and how they are inter related to each others. (These may be just a snapshot of what may happen next, either we have bottomed or continue to go down)
We start with --- C = 0.5 of A (PSEi and LPZ)
Then we check --- C = 0.618 A ( EDC, FLI and FGEN)
Then --- C = 0.782 of A (TEL, SMPH, MPI, FPH) These level's are already a good starting point to BUY, especially when mini waves have already formed in a 3 or 5 waves down.
Lastly, the one who made many people CRY with impulsive selloffs (MWC), this had a 1:1 correlation and value almost lost half of it's value. Charts looking good! Also is forming a bullish head and shoulder pattern
Fobonacci Retracements:
23.6% - seldom used
38.2%
50%
61.8%
78.6%
100%
161.8% -extremes yet probable during rallies, can also be experienced on selloffs
261.8% -super rare
This is why I love charts!
By combining Elliot Wave Theory and Fibonacci Retracements and Projections, we can clearly dissect down charts and see how emotions could lead to something and how we can forecast and make use of other people's emotions to predict stock market!
Although things might not be in shape yet, I myself is having some technical indicators that bottom for some stocks could be possibly in the works or have bottomed already.
I am anticipating a double digit correction in the U.S. soon, but locally speaking(PSEi)- if and only if U.S. extended its gains in a month maybe, we may see good chance to revisit 6100-6200 first before anything else.
I made below retracement targets of "possible" Primary Wave IV.
The usual sequence: Major wave A, then a rally to Major wave B before a final decline to Major wave C to finish any wave II or IV correction.
Please take a look and share how brilliant charts are and how they are inter related to each others. (These may be just a snapshot of what may happen next, either we have bottomed or continue to go down)
We start with --- C = 0.5 of A (PSEi and LPZ)
Then we check --- C = 0.618 A ( EDC, FLI and FGEN)
Then --- C = 0.782 of A (TEL, SMPH, MPI, FPH) These level's are already a good starting point to BUY, especially when mini waves have already formed in a 3 or 5 waves down.
Lastly, the one who made many people CRY with impulsive selloffs (MWC), this had a 1:1 correlation and value almost lost half of it's value. Charts looking good! Also is forming a bullish head and shoulder pattern
Fobonacci Retracements:
23.6% - seldom used
38.2%
50%
61.8%
78.6%
100%
161.8% -extremes yet probable during rallies, can also be experienced on selloffs
261.8% -super rare
Subscribe to:
Posts (Atom)