Showing posts with label FTSE. Show all posts

Friday, April 1, 2016

Europe Indices snapshots: London FTSE and Germany DAX 4-1-2016


Thursday, September 3, 2015

Australia, Germany, London, China 9-4-2015


Monday, June 8, 2015

Germany, London, HK, China and SPX : weakness strikes 6-9-2015


Monday, November 10, 2014

Market snapshots: FTSE, DAX, PSEi, JKSE, HSI and China 11-11-2014


         I know we are all upset with the US and Europe ending with a V-shape recovery vs our expected Major B lower high to end another selloff to Major C to finish Primary Wave IV. Our xmas rally play was ripped off..

Europe(Germany and FTSE) both hit their downside targets(13-15%) which may have sparked the bottom and led the recovery.

Anyhow, let us continue to monitor and adjust things accordingly.


Sunday, October 12, 2014

Germany and London FTSE, confirmed in downtrend, target downside and supports 10-13-2014


We are closely monitoring Germany for the past days/weeks. And the Head and Shoulder formation was confirmed when it closed 2.3% lower last Friday to 8788. The neckline was 9000 and Head and Shoulder pattern was clearly in place.

We laid down some important supports or target downside for Germany

1st - 2year uptrend line since 2012(in BLUE) which broke down with target of 8500

2nd - Head and Shoulder pattern with target of 8000

38.2% retracement of entire Primary III since 2011 could also be around 8180 level

50% retracement of entire Primary III since 2011 could also be around 7500

Roughly saying, if Germany also enters Primary Wave IV, we have a target of 7500-8180 at most or 8000-8500 as a safer bet. Charts looks oversold with RSI 22.

* 2009-2014 bull market uptrend line is at 6750.


London also joined the selloff when it broke below the descending triangle. We are closely monitoring the formation since it began pushing upwards to the 6850 level to make new highs for the year. It managed to hit 6850 6times this year but often closed below that level.

The descending triangle formation has a very low target of 6000-6100.

Other immediate supports are 6337 and 6030

Fibonacci retracements from 2011 lows have a target 6000(38.2%) and 5850(50%)

while Fobonacci retracements from 2012 lows have a target of 6300(38.2%) and 6000(50%)

Roughly saying, London FTSE with RSI of 24 can get lower with target downside of 6000-6300.

* 2010-2014 uptrend line has a strong support at 6000.


Tuesday, October 7, 2014

London, Germany and Russell. Making markets look spooky! 10-8-2014


FTSE seems to break below our post last week with a target of 6000-6100. Another possible support for FTSE is 6450. If it falls below this area, we can confirm that FTSE is going to that direction.

Germany is looking scary as of this moment. The Head and Shoulder pattern is in place and is now the 3rd time to have a base around 9000 level.

A break below 9000 will confirm multiple supports including the HnS pattern with a target of 8000.


Russell is also one of the markets we are looking at. It reached 1076 last night and is looking to break below 2014 support. A fall below have a target of 1000.

DOW,SPX and NASDAQ still is on uptrend but may be looking to follow once these 3 important index confirm something.

This week up to next week will be quite interesting, either we all bounce from these critical levels, or we all break below 2014 lows.

Thursday, September 25, 2014

FTSE and RUSSELL: Critical markets to look into for a bounce or breakdown 9-26-2014


Wednesday, July 9, 2014

NASDAQ, Germany, London and France indices snapshots 7-9-2014


All charts came from COL Financial PH.


Wednesday, April 16, 2014

Complete 1-2-3 scenario for SPX, NASDAQ, London and PSE analysis 4-16-2014

Sorry for not posting for more than a month, quite busy on tasks and travels. :)

PSEi went UP UP and away! feeling great that was able to buy into the bottom 5700-6000 and foreign buyers began accumulating daily making all stocks up for the year!

Before we analyze PSEi, we must see what's happening outside. And technically and fundamentally, it ain't looking good, as much as we see PSEi being very strong. :)

As expected, global markets continued to rally and make new highs for US as they bounced off their uptrend supports(short term and medium term). And one of my strategy is to analyze things once any equity market makes or breaks out to new highs.

US markets(DOW and SPX finally went in sync), while NASDAQ was not able to make new highs.

  #1 SCENARIO(BULLISH) : Main count by Elliotisticians but not my preferred count - 30% chance
  #2 Bearish ALTERNATE COUNT SPX - 40% chance (MY PREFERRED COUNT)
  #3 semi-bullish ALTERNATE COUNT SPX - 30% chance


 #1 SCENARIO : Main count by Elliotisticians but not my preferred count - 30% chance

Primary Wave III is still very far. We are just in the int wave iii and target for int wave iii is 1950 before int wave iv correction then another new high to end Primary Wave III.

Must hold above 1800 to happen.


#2 ALTERNATE COUNT SPX - 40% chance (MY PREFFERED COUNT)


SPX = 1900 = 1.618 of Int i ( to form the Major Wave 5 of Primary Wave III)

The recent all time high of SPX (1897.28) met the 1.618 of Int i wave, and 4% correction came fast. The typical behavior of wave counts.

Analyzing things, we may, "we may" have hit the high already of the Month of April,or the high of Q2 2014. This #1 alternative count of SPX suggest that Primary Wave III has been met and Primary Wave IV coming (10-20% correction). This is the worst count in case it happens.

fall below 1800 will trigger this scenario.

*Weekly SPX and DOW also in Negative Divergence. The last time Weekly Charts went Negative Divergence and corrected was the 20% correction last 2011.


 #3 semi-bullish ALTERNATE COUNT SPX - 30% chance


The 1898 high was just the Int wave i of Major Wave 5, before Primary Wave III ends.

fall below 1800 will trigger this scenario. but must not get below 1740.
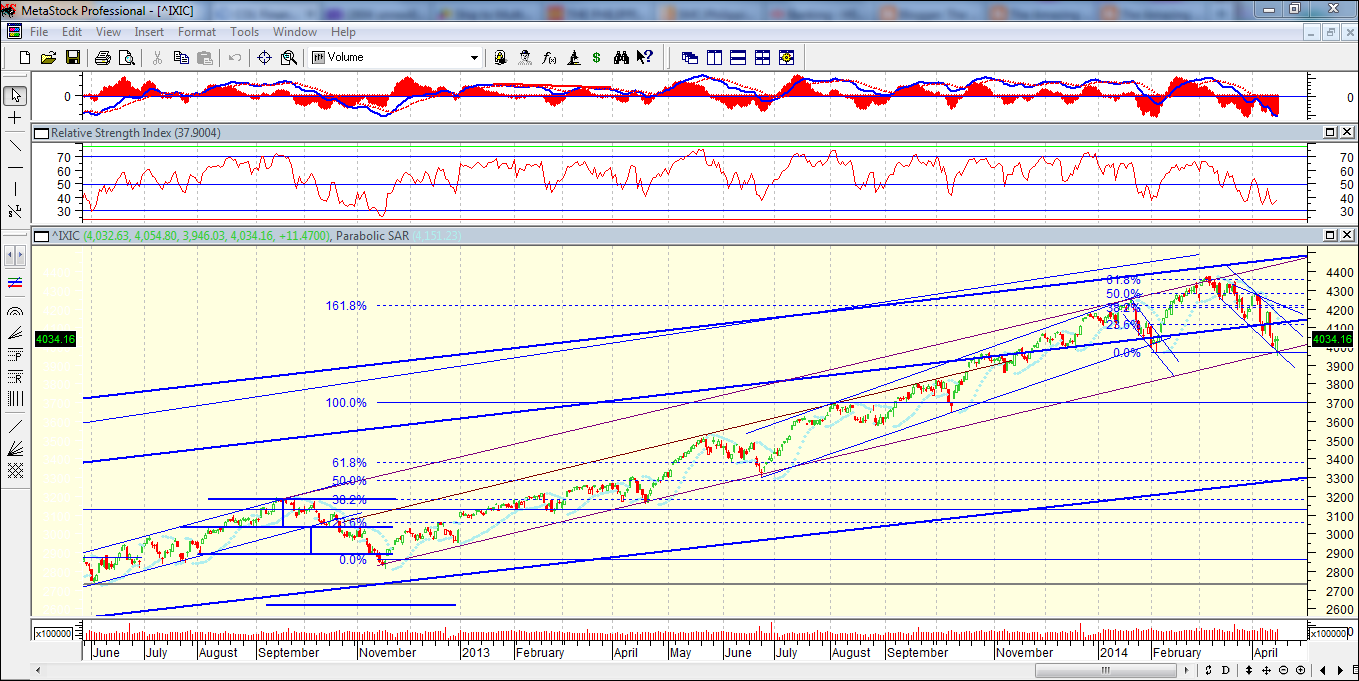


NASDAQ is also in the brink of breaking below its Nov 2012 - April 2014 uptrend, so its a MUST WATCH!


 FTSE is also in the bring of breaking below its May 2012 to April 2014 uptrend rally. So must really WATCH!
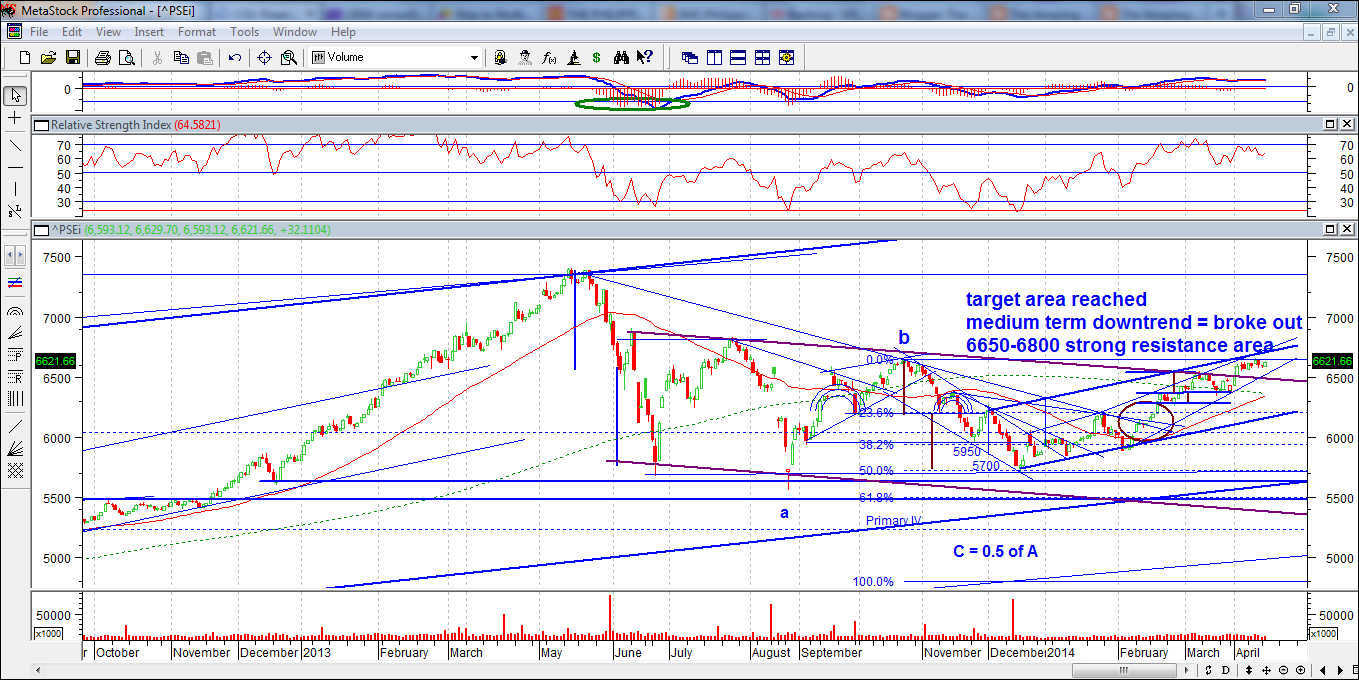


 Good news for Philippines!

We were able to get uptrend momentum when we broke out of 6500 medium term downtrend channel(IN RED).

Short term uptrend is also intact, and we are upgrading it to a Medium term uptrend.

Medium term uptrend is quite overheating and may reach some breather anytime when we hit 6650-6700 level. In the case it is able to get above 6650-6700. Extreme resistance is at 6800.

TEL is still at 2800 and underperforming, so it is quite hard for me to tell if it is time to unload some or buy on breakout.

PSEi now at 20x. Quite uncomfortable level, so sold some positions today and yesterday for profit taking. Still maintaining 75%equity-25%cash portfolio from 85-15

6450 is a good entry level for those who were not able to chase in.


Monday, March 17, 2014

AU, China, London, Germany, HK, Indonesia, Philippines snapshots 3-17-2014