Sunday, January 30, 2011

BDO, RCB, MPI 1-30-2011


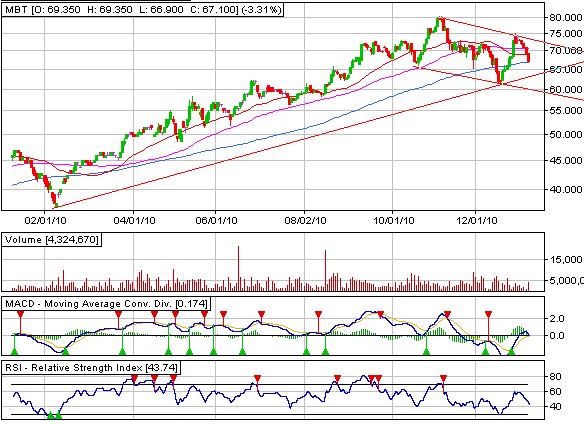
Banks are slaughtered lately due to their "evaluations" by various Firms, I dont really say they are over-evaluated, everything just needs to be in a slow process that needs correction.

One of the good banks is BDO, BDO is also on a short term downtrend in BLUE lines, it really needs a good bounce upwards as its been oversold already with an RSI of 26.xx. Its short term dowtrend lines indicates support of around 50-52 which is a good buying opportunity actually, same as MBT, MBT did a good bounce, but for BDO, im not sure if it has a lot of fans with whaT MBT has.

Long term uptrend line : 50-52, breakdown of which could send it down to 40s, but I think its unlikely to happen as of early 2011.


RCB, the cheapest of all the big banks. Its been a laggard eversince the rally of the banks, and RCB was expected to hit 30s due to high earnings, but the huge correction of the banks made this stock consolidate again.

I have drawn the BLUE lines as its short term trend, a declining triangle trend, or any techincal term they use on it. This is actually my favorite trend line, breakouts of this kind of trend usually floats above anyone else. But as of now, what is scary is.. Its attempting to break down, as what other banks has been doing, break down of its short term trend, could send it down to 24-25. Still its Cheap and still in long term Uptrend.


Manny.. Money.. Manny.. haha.

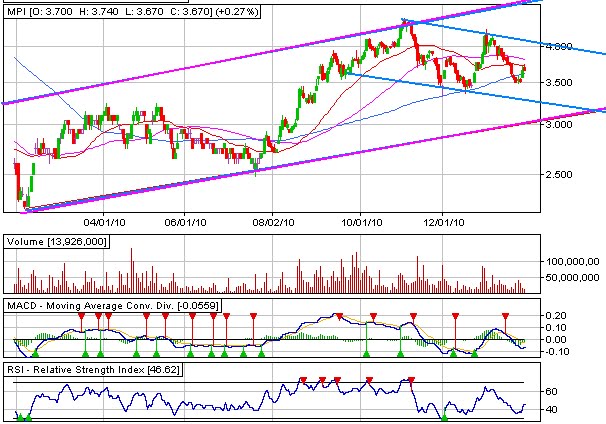
MPI still long term uptrend, with support of 3 and resistance of 4.5-5.0. Short term, ive drawn a BLUE line of its possible path for the short term outlook. If it got to its possible lows of around 3.30 and below, Im surely a buyer here. especially that NLEX SCTEX and SLEX havent been reporting its additional earnings.

..

PSE and DOW JONES 1-30-2011


Every country in the world is now in pressure to raise their Key Rates to fight Inflation. China raised 2x last month, Korea raised 1x, Indonesia raised 1x, others will surely follow including the Philippines maybe this Feb,March 2011. Raising key rates has something of an effect to the stock market. If interest rates in bank offer as much as 10% annual, people in the stock market would tend to shift all funds to 100% safe interest rates.

Philippine Key interest rate stands at 3.xx%, and lets say in around 3 yrs time, inflation is high, having a need to increase interest rates at 6.xx%, that, i guess, 50-50 will stay in banks-equities.

For now, interest rates are not so "interest"ing to have our money multiply with. Equities are still good with usual 10-15% P.A. for the PSE since 1990s.

I still assume that we will follow the short term downtrend BLUE lines which can go as low as 3800 in accordance with the 200MA and long term PINK uptrend line, and that's still my target price to get all my Cash in.


U.S. equities had a resistance to hit with, and guess what, Egypt suddenly rattles with its President sending the U.S. Market to around 2% down in 1 day, could this be the expected correction I've been trying to wait?

If this is really the expected correction, I doubt it would not be very huge in numbers, I would personally welcome a huge correction though :) Rough estimate would be the Pink lines for the short term downtrend, which is needed in ALL equities to correct before hitting new highs.

In its medium term uptrend line, we draw the greyish blue lines to indicate the support to maintain its uptrend trend. Breakdown of its 11,000 support may reverse its uptrend.

Friday, January 28, 2011

MBT update 1-28-2011


After a good strong support we stated early Jan 2011.
http://theamazingchart.blogspot.com/2011/01/fli-and-mbt.html
MBT had a good bounce of its 60-63 support and a very interesting RSI of 30 flat which enables us a good entry point with, so far within this week, it managed to hit 66.xx today.

MBT is short term downtrend, and looks like following to short term dowtrend BLUE line. And still has a small chance to get a highs of 68.xx - 70.xx (its short term downtrend resistance), before it falls down again and continue its consolidation.

In my own trading ways, ill better wait for MBT to go down to 60 again OR breakout of its short term downtrend lines OR hit new RSI lows.

Monday, January 24, 2011

Quoting Tsupitero's Post 1-24-2011

"Take note, the Dow hasn't even dropped yet. There is something strange going on in the US markets right now. While the Dow is still relatively strong, the Nasdaq is visibly diverging. It's like only the blue chips in the US are still strong but most issues are already starting to fall." - Tsupitero

- really like what you said about DOW, indeed strange, unable to fall, but sometimes, really just waiting for something to go downwards. If I am going to choose which path I am, im more into "waiting for DOw to fall down" before reentering the market.

PSE broke its 3950 support as what we were talking about yesterday. Scary yet tempting prices, we'll see where and WHEN can PSE possible find its bottom. Our market really CANNOT follow DOW on its possible 5-10% correction, 10% for PSE = 3500? No way, we cant do that.... "Matutumba" long term uptrend natin.

http://theamazingchart.blogspot.com/2011/01/pse-market-long-term-and-short-term.html

quoting from www.tsupitero.com

Saturday, January 22, 2011

Samsung Electronics(Korea) 1-23-2011


Samsung Electronics of KOSPI index spent its good earnings hitting 1,000,000 won, its all time High since it got its IPO.

This is also one of my most observed stocks as most of the ASIA Pacific funds has this stock in their Top 10 Portfolio (including Bank Of China and China Mobile - to be reviewed soon) and I personally Trade the local ING Asia-Pacific Fund and HSBC's Asia Pacific Fund.

Both funds hit also its 52week highs with 10.45 and 54.81 prices respectively upon hitting 1M Won.

With its MACD weakening, and hitting its uptrend resistance, we will expect again a few walls for this stock, and correction, before it could possible see another rounds of 52 week highs.

PSE market: long term and short term Outlook 1-23-2011


Long term:
PSE's expected correction deepens sending us to our 2 month lows. MACD and RSI still looks weak, San Miguel, Petron and Meralco group of companies' possible Peak and overall has no signs of strength yet for the market. Overall, charts for Long term still bullish with Major support around 3800-3900 area. Breaking down below those numbers will send our PSE equity even to a lower level.

3800-3900 area also is a good point where 200-MA (in red line) meets, and have a very good chance of reverting us to a bullish state. I am bullish in our economy, its just that sending us to as high of 4600 gave us a really overbought scenario which usually takes around 6-9months consolidation phase that we are encountering at this moment.


Short term:
With various bluechips and 2nd liners breaking down of its important support and range (including FLI,MEG, AP), and tempting to break down like (MBT, AC,ALI,RLC). We will surely have a hard time recovering and visiting the top (months period), this consolidation phase really sent us to new weekly lows.

Tho PSE has a good 3950-4200 Trade the range frame. I am still on a HOLD rating to PSE equity, especially with the new Fresh breakdowns. I am not that confident that PSE will hold into its 3950 support, and might breakdown that hits another sell-off.

Another possible scenario forming is the Light Blue short term downtrend line. If ever it really broke down its 3950 support, Light Blue short term downtrend indicate a possible 3800 area support, in line with 200MA support.

I'll be waiting for PSE market to reach around 3800-3900 level (long term support above) before I'll start accumulating and buy-back all the shares i have sold last 2010.

Tuesday, January 18, 2011

2nd liner Properties : FLI and MEG 1-18-2011


My favorite 2nd liner property stock, on my last post last December 2010, i was already tempted to sell all my short term shares around 1.37 resistance, and luckily, i sold half of it.

And yesterday, sad to say that it broke down its major support of 1.29, which sent it down to as low as 1.18. Also, we confirmed that the short term downtrend (in light blue) lines are very strong that its now in short term downtrend. RSI now at 30.xx, and might get a few bounces before it revisit 1.18 or make a new low.

Fundamentally, this must be the cheapest stock right now in terms of its P/E ratio, I bought more shares at 1.18, and looking to buy more near 1.12-1.14 where medium term support is.
If 1.12-1.14 doesnt hold, i dont want to see FLI going back to its 1.00 point.


MEG meg MEG.. while you were running around 2.80, i really knew you are on a temporary bubble, seeing you drop today makes me relax and make me realize how influential Andrew Tan is in terms of making money from Business and playing Stocks.

MEG is still on a short term downtrend, and making new monthly lows hitting 2.20 a while ago, comparion FLI and MEG, i still see MEG to be prone in larger downfalls.

short term downtrend support is around 2.0-2.10 (blue lines), and possible medium term support is saying (please go visit me) around 1.90, 1.80 and 1.70 respectively (dark blue and pink lines).

Overall, im still slightly bearish and waiting for the hopefully soon-to-be expected correction as posted last:
http://theamazingchart.blogspot.com/2010/12/12-26-2010-xmas-post-and-xmas-rally.html
Good luck!

Monday, January 17, 2011

Power Plays: FGEN and EDC 1-17-2011


Fgen lost its momentum when it got its short term peak at 14.xx last Oct 2010. And now, with PSE short term trending down and consolidating, so this stock is, Short term support stands around 11-11.3x where I am interested buyer in. With FGEN overall medium/long term is uptrend, im a sure buyer here with a possible 15pesos resistance by Mid of 2011.

Fgen is also a good range trade, but on a downward cycle, a breakout of 12.5 will confirm and be back in its uptrend cycle.


On the other hand, another Power industry, just recently broke out of its range from 6.00 resistance. We have confirmed its short term uptrend when it is strong uptrend from breaking 6.0 to as high as 6.26 today. We'll just wait some more time before it can get its 52week high of 6.5.

Trade the 6.0-6.5 huge range for this short term uptrend technical view. A fall below 6.0 can make it consolidate again and maybe a short term downtrend again.

AP went on to MAYBE its 52 week high already, and if power players went out of AP, what other Power stock do they think next? Its probably EDC's turn to shine :)

Saturday, January 15, 2011

The DOW and PSE Markets 1-16-2011


As my guide, i have been following wave counts also, and so far, based on the charts, seems that minor wave 5 (intermediate wave 1) is near to end or might have ended already last Friday. It was extended already by 1 week from my last weeks projected short term peak. Which means around 4 weeks of correction ( formation of intermediate wave 2). Which im really waiting for before re-entering the market.

Looks a clear cut and warning to me, but lets see in the next week's Global movement when we will see our Equity in the next couple of weeks.


PSE market failed to breakout of its formed inverse head and shoulder pattern. Tho we failed and had a 5% instant downward after the failure of HnS pattern. We are consolidating and expecting to trade the range of 3900-4000 to its 4235 resistance.

The Pink lines are the medium term uptrend support, which leaves our market overall in an uptrend phase.

Overall, im still bullish with the PSE market, but with my biased waiting for correction strategy in the U.S., leaves me wanting to sell more than to BUY in these recent dips last week.

Holdings:
Dollar funds (Short term)
- 100% Cash
Peso funds (short term)
-25% cash and trading the range

Monday, January 10, 2011

FLi and MBt

FLI and MBT are in short term downtrend, yet these are some of the big trading stocks which moves fast and came down to around 10% since last week.


FLI is short term downtrend, with a strong support around 1.29-1.31, this is a good support on a declining wedge pattern, breakdown of its 1.29-1.31 support can make fli go down to 1.20s. Breakout of its 1.40 range may seek to its 52 week high of 1.49.

This is the one i tried shorting out from its 1.37 high, but made out for a few minutes to its 1.41 highs last week. Today, i reentered some of the portfolio with entry price of 1.31


MBT is one of the fast moving stocks. Sad to say but when it hit its 75.xx high last week also, furious selling pressure was seen making it close 72.xx for the end of 2010. Today , MBT lost another few sets of %, yet looks interesting to me as it goes down close to its uptrend support.

Short term downtrend may lead us to 65, and strong selling pressure could breakdown our medium term supports that may lead MBT to 60.

I sold all of my MBT in the 75.xx, and still sees MBT a good fundamental and technical stock, 60-65 is a good entry point for the possible coming correction.

PSE around with fears

US holiday season extended with an almost 2% gain during the start of the year 2011.

While hitting new highs, we were talking about PSE trying to make away with the inverted head and shoulder pattern.
http://theamazingchart.blogspot.com/2010/12/12-30-2010-year-end-special-back-to.html


Late last week, PSEi managed to attempt to break out of the 4235 points, in order to confirm the inverted head and shoulder pattern, i was actually scared when it went to as high as 4245 pts, which leaves me blank if it really did make a breakout. I am bearish on this one, and want this correction to still persist in accordance to the expected correction also in the US market.

The PSE had a false breakout for the attempt to break 4235, and now got an 86 point drop, which covers PSE with fears, or really just a profit taking mode now? - without any huge drop yet to the US market.


PSE short term is still downtrend, pegging at a light support at 4100. and medium term, heading towards as low as 3850-3900 support, breaking down of 3850-3900 support invalidates our Long term Uptrend.

Lets say we estimate the correction of US to be 5-10%, on a rough idea, 3850-3900 is a very attainable correction for the PSE market.

Lets see what U.S. market can still do to our market, as they are still 50pts away from their 52week highs.