Wednesday, January 30, 2013

Global and Asia Market: Finding a possible short term peak 1-30-2013


For the past 2.5 months, we had a good 12% rally with no definite pause or stop. 2013 January was also one of the best January since the past decades, returning 6% for this month only.

Technically speaking, this is expected as we are currently in the 3rd leg or wave of the Primary Wave III of Major Wave 3. Wave 3’s are usually the strongest and long lasting in terms of wave structure. Looking at Equities on a Global view, we may need to have a good correction of 3-10% with the ff observations for DOW and SPX:

<![if !supportLists]>-          <![endif]>Dow/SPX when subdivided into micro/minor waves, we are having 5micro waves up inside 5 minor waves.
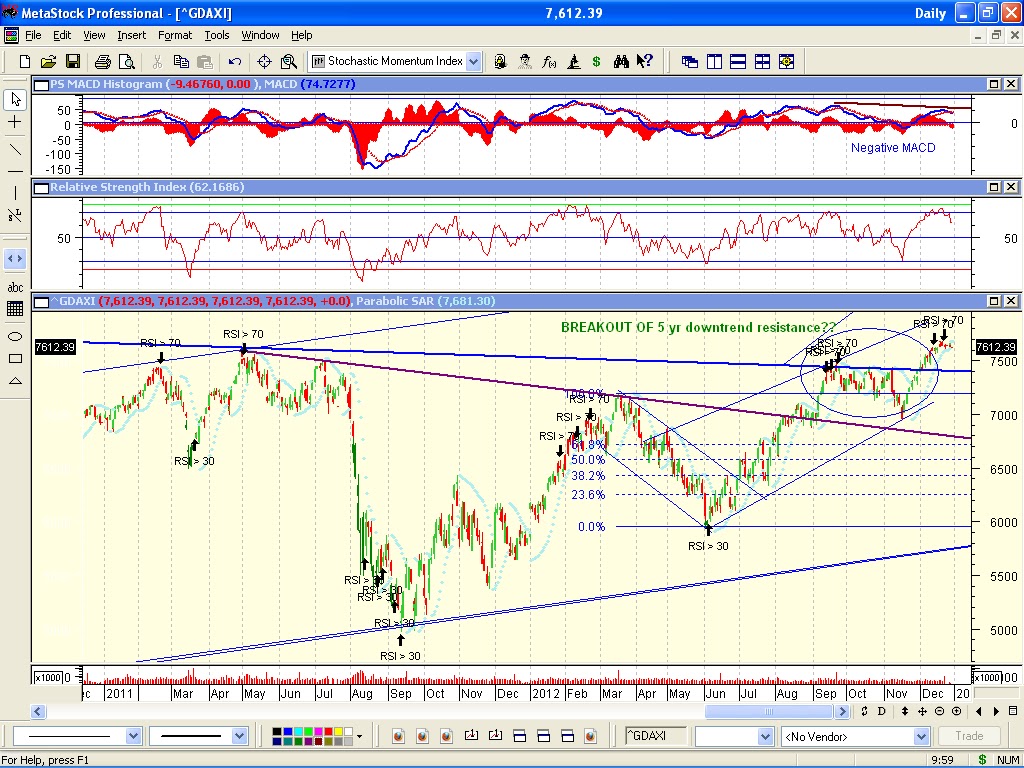
<![if !supportLists]>-          <![endif]>MACD and RSI for Daily and Weekly charts are Negative.
<![if !supportLists]>-          <![endif]>RSI(5) on Daily charts are at 90. Relatively overbought.
<![if !supportLists]>-          <![endif]>Weekly MACD are in Triple Negative Divergence, while markets reached new high 3 times.

The rally may extend before correction comes, or may correct tomorrow or next week. High probability that after correction, resumption of bull market to finish Major Wave V to finish Primary Wave III. Then meltdown of 10-20% correction is in place(could happen months or quarters from now) which is Primary Wave IV, then ending Primary Wave V with a final rally that could end late this year or next year.


Looking at Asia Pacificthat China’s good 2012 GDP raised the roof of underperforming Countries like HK and AU. Currently, their net gain since Nov low was at 13-14%, outstanding performance compared to the negative 2011 returns for these 2countries.

Looking into their daily charts:

HK – Weak RSI and MACD forming and have a 2yr resistance at 24000-24200 levels(2011 highs). Although we expected China already bottomed last year and is making a comeback, we still seek 24000-24200 level as threat for any strong resistance short term. Although things are possible and relatively cheap at 13x, we are not yet pushing the targets to 26000 level until DOW reaches 14500-15000 level.

AU – the enormous rally from 4350 to 4950 level is a never been seen rally for this country since early 2000 and 2007 peak. 14% was too fast for 2.5months making it have a P/E of 18x. RSI and MACD are also weak having a signal of negative divergence.

Overall, there is nothing to lose to pause for a while and unload 20-50% of overall portfolio, depending in your guts and wait for a good correction to re-enter.

Wednesday, January 16, 2013

Elliot Wave status and forecast-Bull Market status 1-17-2013


Elliot Wave Analysis suggest that 90% chance of what we are experiencing today is still a Bull Market with the ff. analysis:


With few headwinds coming due to Negative Divergence of MACD and RSI of the Weekly Charts of SPX. A fast rally to new highs should make MACD and RSI strong.

<1. (30%) – too bullish scenario –
a. we are currently in the Primary Wave V end of Bull market, and is in the minor wave 3 of Intermediate Wave 3, we expect to reach new high (1400-1440) and then small pullback then finish off to new highs to finish minor wave 5 of Intermediate Wave 3,then a sizable amount of pullback for Intermediate Wave 4, then finalizing the Bull Market with the last final bang.
b. This count abide some of the Elliot Wave rules namely: Primary Wave III is the shortest, Primary Wave IV went below Primary Wave I. and this is just a model scenario of what may happen.
2. (60%) – typical bull market and is extending
a. 2011 deep correction was just Primary Wave II, and we are currently in Primary Wave III, and waves are subdivided into small waves. Taking a look into smaller waves, we are in the Intermediate wave iii and a few more rally and make new 52week high before intermediate wave iv correction could happen (5-10%),then a rally to close the intermediate wave v (Primary Wave III), after that,expect the biggest pullback that can amount to 11-20%, like Primary Wave II 2011 correction, then a final blow to end the Bull market by finishing Primary Wave V.
b. Targets to finish intermediate wave iii is at 13700-14000, other targets will be depended on the wave structures,will post more soon.
3. (10%) – Bear Market Correction
a. This scenario is unlikely to happen, but can still be the case. If we closed soon this month and sold off by 10% or more, this scenario can happen.

Wednesday, January 2, 2013

AU, SPX Daily,Wkly, Germany Daily,Wkly and HK 1-2-2013


As expected, the Global Markets continued to rally into the first few days of the Year. Historically, this has been the scenario,when if markets sold off by Oct or Nov, and valuation is good, jump into the markets as 85% of the time, Markets rally enormously Dec end for Yrend window dressing and until early January for myths that if January net is Up, its going to be Positive for the whole year.

We first tackle AU, We have last seen AU getting from RSI = 30 to RSI = 70 in a matter of 1.5months and 10% rally without any decent pullbacks. This behavior was last seen on 2006 when Global Rally was sceptical. Although Global Markets did a good job on their P/E, I still suggest that this behavior seen in AU can possibly not last long,and may expect some pullback very soon. P/E isnt that good either at 19x.

Every time AU hits RSI > 70, it corrects an average of 5-8%. Last time it hits above RSI 70 was April 2011 and Oct 2012. MACD also reached +50 where historically speaking that rally should pause soon.

Short Term: Uptrend but lighten
Medium Term: Sideways to Up,may revisit 5000 2 yr high soon.
Long Term: Sideways between 4000-5000.


We last tackled Germany last 2 weeks ago,when it was attacking the 5yr downtrend resistance. And after the expected pullback to 74xx, Germany continued to rally and confirmed the breakout. Medium Term down trend was upgrade to Sideways pattern. This was fueled by better GDP of European big 3 (Germany,France, U.K.) due to London Olympics.

Spain and Greece news are now absorbed by the investors in a Neutral way, as people are still awaiting for worse news. Still, Spain and Greece are ticking timebombs,ready to explode and send markets lower.

Our indicators posted that Germany hit RSI >70 twice last Dec 2012. These were never been seen since May2011 and March2012. Negative Divergence on MACD is seen and could have some good correction. P/E is at 13, with some cautious reminder since RSI is high and Negative Divergence is seen on MACD.

Short Term: Uptrend and peakish short term
Medium/Long Term: Broke out of 5yr downtrend resistance, but Germany weekly charts shows Negative RSI. A warning. Next resistance is 7700-8000(2007 highs). I still put warning on Germany/Europe as they even nearly reached their 2007 highs compared to the healthier U.S.


 Germany Weekly Charts


SPX just rallied 2% last night due to Fiscal Cliff deal, and been the expected behavior of US Equities on the first few days of Jan trading. Charts look good, P/E is at 14.8 (slightly above 13.5x average) and may continue to rally into few more days or even up to end of Jan. RSI and MACD of Daily Charts are healthy due to good corrections, and has rooms for more rally. (assuming no bad news).

Short Term: Uptrend
Medium Term: Uptrend with support at 1395


SPX weekly charts on the other story has continuation of its Negative Divergence that caused Nov deep correction, the Negative Divergence effect may not be done,but once we cleared to 52 weeks highs and continue this good rally, the Negative Divergence will be omitted soon.

Long Term: Uptrend with support at 1350


After 1.5 years of being underdog, HSI finally brokeout out of 22,000 and is pushing through the limit to breakout of 23,000 and 23500 to revisit 24000 level. Although we are seeing a downtrend resistance at 23,000 for Medium Term, it likely brokeout of the range and may revisit the next resistance at 23,500.

23,500 level serves many resistance points and factors:
<1. Short Term uptrend channel is very steep and pointing to a probably 23400-23500 top this week.
2 2. Medium Term Downtrend resistance since 2010 top is pointing to a 23000-23500 downtrend resistance.
   3. RSI is in Negative Divergence
   4. RSI never hit 70 this rally

We may see HK and AU correct and shed some of its gains,but surely,HK is now in a better chart/shape to resume its uptrend, as China Equity may already bottomed and started to Uptrend. A Correction to 22,000-22800 is advisable before the next leg of rally. P/E is slightly cheap at 12x.