TEL bottomed short term after hitting 2572. Bought a few shares near 2582 and is expected to reach 2700 level.
TEL recently broke down from 2700 level and now became a resistance, if
TEL manage to get up to above 2700, we may see it reach up to 2750-2790
until end of year.
PSEi manage to get up by few hundred points with the help of overbought rallies of TEL,MBT,BDO, SM and others.
PSEi resistance is now at 6,200, where it broke down recently.
6200 resistance :
- where it broke down
- downtrend line since end of Oct
- 50% retracement of Nov 18 peak before it went down near 59xx level.
Thursday, November 28, 2013
Tuesday, November 26, 2013
SPX update 11-27-2013

SPX made another all time high, touched 1808 and closed at 1802.
This 1802-1810 resistance could be very strong in the coming days/weeks to come, US equities already increased by 30% by this year only, all are expecting a Santa Claus rally, but the YTD is yelling that it may have been too much.
Charts are currently hard to predict, but I guess, a quick pullback should happen 3-5% before any new highs for the year. (50%)
or Primary Wave III must end this year and a sizable amount of correction will end this 2013 (30%)
or we breakout at this point without anyone expecting its coming and make new highs for the year and finish Prim Wave III or Major Wave III by January 2014 (20%)
Monday, November 25, 2013
MWC broke down as well :( 11-26-2013
MWC
broke below its 4.5yr uptrend(25.0), its now trading way below the
support, now at 22.9, its hard to believe that most bluechips stocks are
'technically' becoming into bear market, and supports are below:
21.5 - 61.8% retracement of the entire 4.5yr bull market
19.0-20.0 - technical 2008 and 2011 top
Sad to believe that day by day, an important component of PSEi is deteriorating..
21.5 - 61.8% retracement of the entire 4.5yr bull market
19.0-20.0 - technical 2008 and 2011 top
Sad to believe that day by day, an important component of PSEi is deteriorating..
FLI broke down and TEL very much in focus 11-25-2013
Filinvest
Land(FLI) most probably broke down below its 4.5yr uptrend (1.40). -
Need to be confirmed in the following days to come
TEL is also looking to break below its descending triangle and had a 52week intra day low at 2658
TEL is also looking to break below its descending triangle and had a 52week intra day low at 2658
TEL confirmed breakdown 11-25-2013
TEL confirmed breakdown. Short Term Trend: From sideways to downtrend, target downside is near 2500-2550.
Technically speaking, this descending triangle breakdown could trigger selloff up to 2420. Due to the length target of the descending triangle.
PSEi index could face more downside due to Tel's weakness. RSI now at 25.
Long term support still uptrend at 2200. But Medium term support from 2011-2013 has broken down and became sideways to down.
Short term supports: 2500-2550
Medium term supports: 2400-2500
Long Term supports: 2200
Wednesday, November 20, 2013
PSEi breaking down and MBT FGEN looking bad 11-21-2013

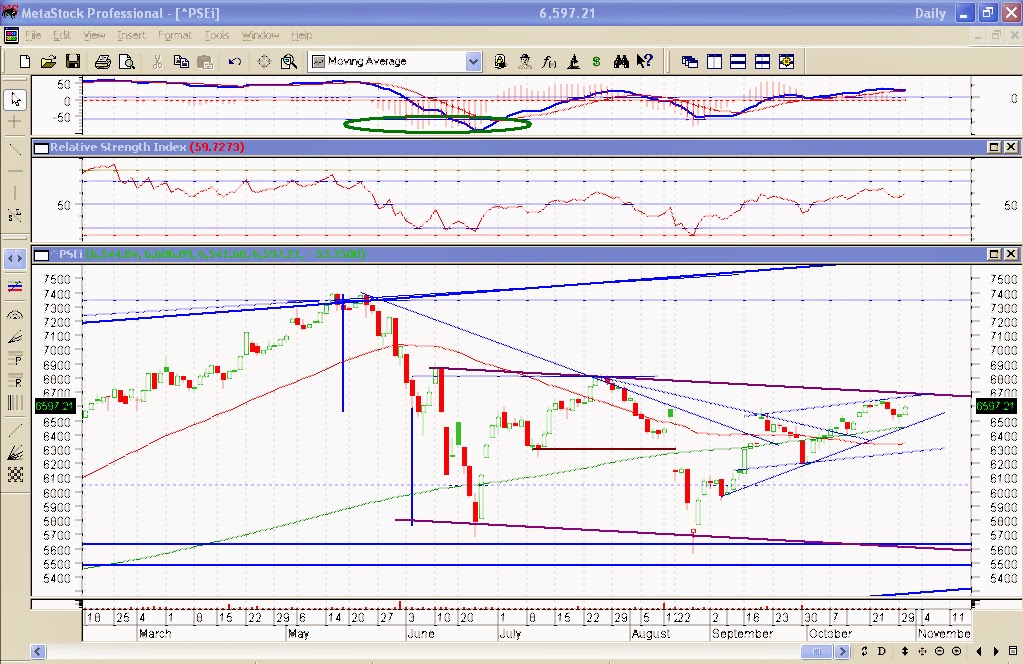
PSEi fell off a very important support(6200). Intra day it held above 6200 but sank down in the afternoon trading closing at 6150 - a clear indication that PSEi broke down again its important support.
Typhoon Yolanda destruction is one of the reason that sparked the selloff, but looking into our neighboring countries in Asia, Jakarta and Thailand - most of the top 5 countries that led the best for 2012 YTD, are almost -20% for the year. Completely the other way around against Germany and SPX at an estimate of +20% YTD.
Mid 2013, we have already plotted the sideways to down pattern for PSEi (dark red), and we still traded with high risk on selective stocks, I myself got stock on some of the stocks which made me think that, in this kind of market, investing in Equity Funds is better and has a lower risk.
Now that an inverted head and shoulder could have been triggered, a target of 5700 is in place, very far from our current index price right now. (50% chance).
Short term support is at 5950-6000 then to our 52week low near 5600-5700.
What I am scared of is that our PSEi index is still tagged in a Bull Market, for the reason of holding to its 4.5yr uptrend support sitting nearly at 5340. BUT, BUT, some blue chips hardly cannot rise and broke below their 4.5yr Bull Market channels, namely MBT FGEN LPZ and so on. Which could lead to new 52week lows in the coming weeks/months to come. Other bluechips analysis to follow..
Portfolio: 60% Equity - 40% Cash
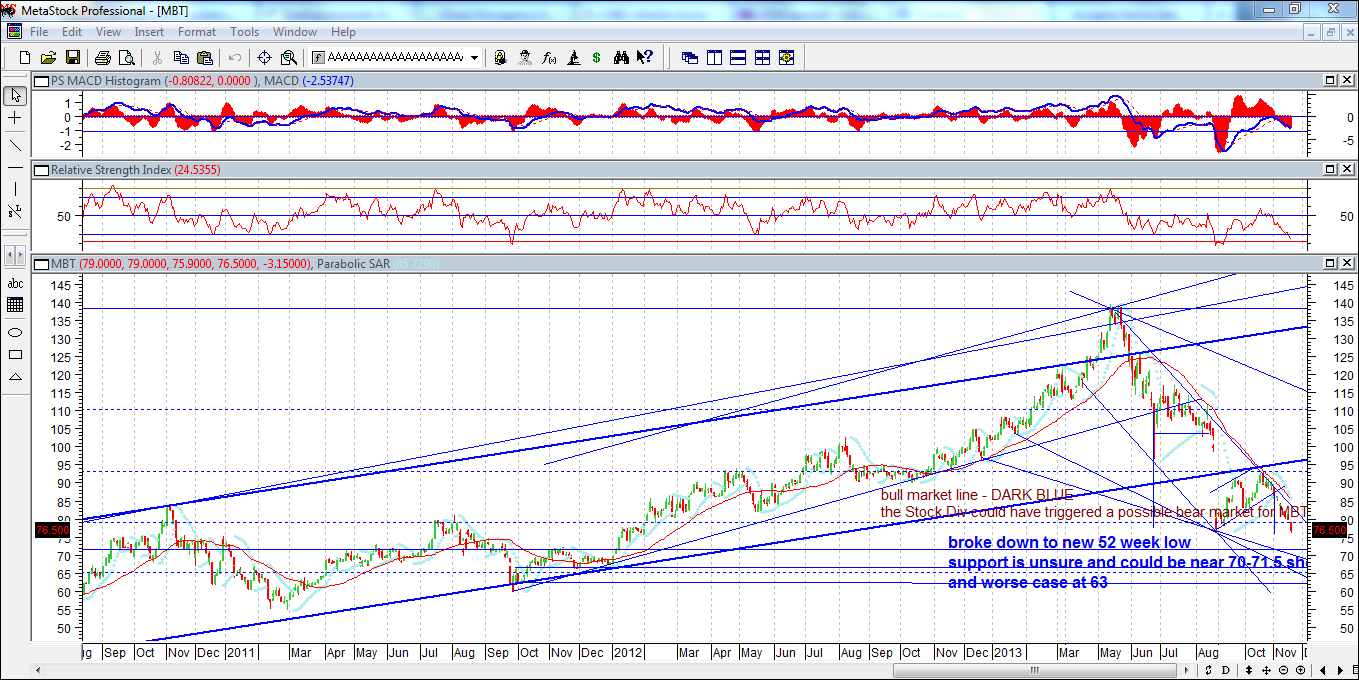
MBT - the first bluechip bank to fell off its important 4.5year uptrend, the stock dividend must be blamed for what has happened to this stock. Although fundamentally speaking, it might still be strong even after giving 30% stock dividend. In technical terms, a breakdown is a breakdown.
Attached above the chart of MBT, and dark blue channel I draw are usually the 4.5year uptrend lines, day by day, I see stocks break below their important uptrend lines causing more selloffs in the market.
I was catching MBT near 80 for the reason that a small uptrend channel is looking good, days later, it fell off easily and expected that 75.5 to 76.5 is a good support.
Today, 11/21/2013 AM trading, it fell off to a new 52week low. really very bad with a good fundamental of P/E 8.0
I really feel that no one(Local or Foreign) that supports these stocks which are in critical conditions. Sorry to say but these kinds of observations happen during a "Bear Market", letting stocks break below easily and reach 52 week lows.
Short term support at 70-71.5, and worse scenario at 63. (31.8% retracement of the entire 2009-2013 bull market)

FGEN and FPH blew up when typhoon Yolanda affected middle portion of the Philippines, bringing electrical posts down around the region.
FGEN was one of my best bet on range trades as it succeeded holding on to its 4.5year uptrend support last May 2013 and bounces from 16 to 19.
But recently, the storm killed this stock, making it clearly break down and fall into Bear Market territory. Freefall was seen from 16 to 13 in a matter of days and it is now trading at 12.xx
I cant believe that its running low (71.8% retracement of entire 2009-2013 bull market), no one knows when the freefall will stock, I also bought some of this around 13-13.5 for the reason that magnitude of breakdown is near that area, but seems that no support/buyer is willing to hold them, so I need to downgrade the support near 11 to 12.50 (very very near to its all time low at 9.xx)
Elliot Wave analysis shows that FGEN could be in a Major Wave 3 selloff of Primary Wave C bear market, and Major 4 and Major 5 upcoming before it can possibly bottom in a new low or in a flat pattern.
Lopez stocks ran out of steam
Some stocks unexpectedly broke down below its 4.5yr uptrend and entered Bear market:
FGEN - when it broke below 16.00
FPH -when it broke below 76
Other non-Lopez stocks are looking to break below their 4.5yr support as well. Making the market very weak and prone to a possible new low..
Will post more analysis soon..
FGEN - when it broke below 16.00
FPH -when it broke below 76
Other non-Lopez stocks are looking to break below their 4.5yr support as well. Making the market very weak and prone to a possible new low..
Will post more analysis soon..
Thursday, November 14, 2013
SPX complete analysis of daily and weekly charts 11-15-2013

US stock market has extended quite very well, with interest rates in the U.S. went near 2.80% level again for 10yr bonds, investors are now really challenging the tapering of the FED in the near term, that is expected to lower bond buying programs or even stop them for a period of time.
Most analysts forecast a rate of 3-3.5% 10yr bonds on 2014, and increase is bonds will further weaken equity and will make 10yr bonds below PAR.
Technically and theoretically speaking, we could be in the upper resistances and could top soon. Three major indicators, which are generally effective 70-80% of the time, are already shouting that a possible correction is due soon. The only reason and the tricky part of all is that, we are still making newall time highs, and whoever institution is doing it, is making the public investments get wary, chase the market and then Kaboom, public investors are trapped and institution making lots of money. The typical emotional trap in a Bull Market.
First and very important indicator: The parallel lines of our entire 4.5 year bull market. SPX/GSPC is pointing to a very strong resistance near 1800-1822. Merely 10pts from where we are right now. This indicator or technique is widely used by any technical analyst or even noob investors, it is widely used in stock as well.
Second indicator: Weekly charts in SPX is pointing a triple negative divergence on the RSI.
Last and theoretical indicator: Elliot Wave Analysis. The market and the investment firms are very good in populating and trading the US markets, every time we call a possible peak, it overextends, making us chase the market again and again. And like what happened in the Philippines and Indonesia Markets, nobody expected it and people are busy counting they enormous gains throughout the day without thinking that market has been exhausted already.
Elliot Wave count suggest 3 scenario:
1. We are in the final waves of intermediate wave v of Major wave 5 of Primary Wave III Bull Market. Next is Primary Wave IV correction which could be 8-20% (50%)
2. We are in the final wave of intermediate wave v of of Major Wave 3 of Primary Wave III Bull Market. Next is Major Wave 4 which could be around 5-8% (30%)
3. Lastly, the smallest chance but fooled us twice already for the past 6months, is an over extending again of intermediate wave v and extending another 5 waves which could run into early January (20%)

Another indicator we usually check is the timeframe of waves.
Sometimes it is just for fun,but sometimes time relation is also important.
SPX weekly charts above shown have green lines.
First green line is the 2009 bottom until Primary Wave I peak around March 2011.
Second green line is the bottom of Primary Wave II until a possible Primary Wave III peak.
Primary Wave III is usually the longest of all,but can be 1:1 ratio with Primary Wave I.
At the end of the month, we could finally find out what is in for us. Good luck to everyone!
Sunday, November 3, 2013
SPX update, Germany, HK, PH and Indonesia 11-4-2013

Sorry for not posting any update for the past 2-3months, quite busy doing errands. :)
To recap what happened in the past few weeks, U.S. made new highs after resuming work on Government Shutdown and moving the deadline of debt ceiling to Jan-Feb of next year. Our target correction of double digits(10% or so), was cut into half, and US rallied into new highs. Quite short that we were not able to chase in the gains.
Remember that US companies are earning good amount of money, hitting new all time highs, but the US debt is increasing every second, making some catalyst that may possibly downgrade US govt bonds/debts by early next year. At worst, a US bond/debt default.
Now that Elliot Wave Analysis suggests that US extended its Major Wave 5 of Primary Wave III Bull Market, we should be ending the minor wave 3 or 5 of Major Wave 5. And the double digit correction should be seen soon, to compensate the 20% YTD rally of US Equities for 2013, before rallying into new highs until early to mid next year. US Equities are now at 15-16x, around the historical average. (60% chance to happen)
A possible 3-6% correction could be happening soon before making new highs, and delaying the expected double digit correction by Jan, coinciding the debt ceiling issue (40% chance to happen)
Europe Equities also made 5 year highs, and hitting 70>RSI levels and reaching the upper range of the entire bull market, so there's quite a hint, that a slowdown in rally could be in place very soon.
Asia Equities on the other side, like Jakarta and Philippines are taking time to digest the rally they gained from 2011-early 2013. They are still 10-15% from the top, and are in a sideways pattern. Low volume and low foreign buying left them in a sideways pattern. Their PE is at 20x and 19x respectively, still above average, but GDP are in good shape.


Subscribe to:
Posts (Atom)