Friday, June 29, 2012

Dow and China 6-29-2012


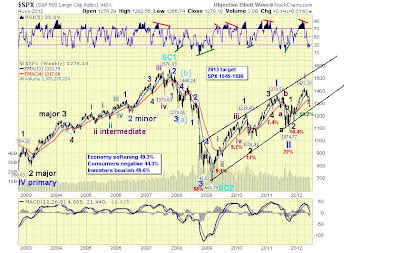
With regards to our post 4 days ago, Dow Jones is currently on a short term uptrend line, which has support around 12300-12400, and so far, it seems to find it as a good higher low.

Elliot Wave count also is looking good, and must not break below that level to be placed the count at ii of 3 of Primary wave III. Overall, this market could be a trade the range season, and today's closing might be a possible H1 Window dressing which resistance is at 12775. I wild guess that we will close near that level tonight. 

Short Term: Uptrend
Medium Term: Downtrend channel in BLUE
Long term: Uptrend lines still intact but might break down into a sideways pattern.


GDP of U.S. was at range, a positive 1.9% growth QoQ. Shifting to the Asian channel. China is globally known to push growth all over the world, they are predicting a soft landing, but I myself is concerned on its current level. at 13x P/E Ratio with 8% QoQ GDP Growth, this should be increasing in value, and not this 2 year Long Term downtrend lines. Where peak was 3500 on July 2009.


Another concern for me is that, SSEC is nearing its 5 yr lows. or close to 29% just below the 2009 recession lows (1700). This is a dominant market, and not be a bearish companion all over the world.

Why is SSEC so weak? I really dont know also, I guess everybody should still get back to following DOW and SPX and Germany as indicators where global equities with go.

Short Term:downtrend biased, but close to finding support.
Medium Term: Downtrend Channel intact
Long Term: This RED Line below, should hold this market into an upward phase, if it doesnt hold, we see 2100, then 1900 then 1700 (the 2009 lows). Anyone wouldnt want to see China get back to 2009 lows. Something should be pumped here in my opinion.


Sunday, June 24, 2012

Dow Jones and SPX retraced 61.8% the May lows, and paused 6-24-2012

Over the past decline, a total of 10.5% was shed from U.S. Markets, and up to 15% from Asian Markets. We noted that 12710 was the initial resistance, and the market stayed above for 2 days reaching 12850 at close for the DOW. The decline last Thursday was a huge 2%, that was an expected pause for the ff reasons:

1. SPX has the 1262 major resistance.
2. both SPX and DOW retraced the 61.8% of its entire decline.
3. re-adjusted the possible downtrend line for DOW and SPX has been noted down. and 12850 was a resistance and 1365 for SPX.
4. Germany also bumped into its downtrend resistance at 6450.

In Elliot wave count, we still count the decline as possible correction only, we temporary label it as Minor wave ii of Intermediate 3 of Primary Wave III. A fall back below to 12100 destroys this count.

Overall, its still uptrend biased, as possible uptrend formation trendline is formed shown in SPX chart. there is still 1-2% risk, and no more than than should be entertained to keep this market uptrend even for a short while.

Markets should soon be back to that 61.8% retracement (12850 and 1265), and break out through the downtrend lines, to revisit our 52 week highs.


Market: Short term: uptrend and chances are high for possible turnaround.
Short-term to Medium term: Downtrend, due to downtrend lines.
Medium Term: Uptrend still intact

Saturday, June 16, 2012

Best strategy If you hate fluctuations and want to invest in long term products like Corporate/Foreign Bonds 6-17-2012

EXAMPLE OF 2000 Bear to 2007 Peak Indicators.

If you hate fluctuations and want to invest in long term products like Corporate/Foreign Bonds. Here is a good and basic way to be RICH in the future.

It doesn't take too much knowledge and technical stuffs to get into or out of the markets. This is a reliable guideline, NOT the best, but a good thing to follow if you hate huge fluctuations in the market.

We all know, European Crisis will not end so soon, and people now withraw money and move them into safe assets. Well this is one of my personal recommendation, and its up to my followers if they wish to follow or copy this easy reliable long term investment knowledge.

In my example, we only require a few things, or things to be assumed in order to start with the "Plan":
1. On a yearly basis, we earn some money, put some asside, to "ADDITIONALLY" invest in bonds/assets
2. This money is for long term savings or investment, and not to be withdrawn unless emergency (as may take some loss during fluctations in early entry points)
3. Check on a weekly basis at least how market is going. Every 2 weeks is OK. (this is to grab opportunities when it's there)
4. Learn how to see the basic Technical indicator = RSI (can go to www.stockcharts.com for easy availability)
5. Check DOW and SPX alternately for more view of the market.
6. Find a "SAFE" fund or bank who sell Foreign/Corporate Funds (you may select your own location), which gives monthly,quarterly or semi-annual Dividend or Interest rates (BETTER with dividends/interests which are computed pro-ratedly)

7. Remember: BUY on Daily RSI at 30.0 or below, and SELL on Daily RSI at 70.0 or above.
8. Bear Markets usually always hit RSI 30.0 and rarely hits 70.0 and vice versa for Bull Markets.

 Things to DO if all above are within your means,you can now start using these guidelines when to BUY/SELL into markets: 

1. Assuming you started with 100% Cash. You can segragate your entry points, some entry points are months/years time, so weigh your options and time-related needs. Example is BUY 50% when RSI hits 30.0, and BUY 50% when it hits next (You can select DOW for indication, or SPX for indication, or you can weigh both DOW and SPX for your entry points). You can also select 33%,33%,33% on your entry points.
2. Then we assume you are 100% into Bonds or any dividend yielding assets. We SELL 50% when RSI hits 70.0, or SELL 25%, depending on your risk appetite.
3. Then when we are able to SELL, we again wait again for RSI to dip to 30.0, and re-enter the market.
4. Its an endless cycle, just wait for good indicators for ENTRY-EXIT points. Be selective on good-fitch rated funds at BB or above, to be safe from Default issue related problems. Just be patient when Bear Markets occur, as assets tend to lose a lot of value, but then stabilizes when resumption of Bull Market.

When RSI is at 30.0, Bond/assets usually decline in value about 3-8%, and when RSI is at 70.0, Bonds usually are slightly overpriced at 3-8% gain.

So when luck is there, and opportunities strike, you may gain 3-8% or more plus the dividends/yields you are getting.

Be selective and segregate the funds, there are a lot of opportunities in the markets. Some funds usually give Monthly dividends yielding 6-7.5% per annum, good option to start with, or maybe Corporate Bonds yielding 5-7% per annum.

Good Luck!

Friday, June 15, 2012

Dow Update and forecast for next week. Greece Elections 6-15-2012


 Over the past 2 weeks, we noted down a few check-list why short term selloff may bottom, and we certainly had a chance to get it right, these indicators were:
1.       Weekly RSI hit 30.0, last time it hit this level was Oct2011 last year.
2.       Positive Divergence in Daily RSI. Green Line.
3.       Elliot Wave count may have formed a complete a-b-c correction. ( we Initially forecasted to stay at 12310 level, but there was 2 day time period where it stayed below 12310 (might was a Bear Trap)

Now, we are now again in the important resistance/support levels and upcoming Economic Calendar.

a.       MAJOR RESISTANCES to advance Further:
12700 - wave iv lows of Major Wave 1 of Primary Wave III
12700 - downtrend resistance of current short term trend

b.      MAJOR SUPPORT need to hold to avoid further decline:
12000-12100 - June lows

c.       Greece June 17 Elections

We layout the Chances of Short Term-Medium Term Trend to be bullish at 70%, and bearish at 30%. Raised from 50-50 during 12031 lows. Greece’ future and Monday’s Global Equity response is dependent on June 17’s Election Results. If Pro-Bailout wins, outcome is bullish, if Anti-Bailout wins, its bearish.

Chances made above is based on Estimates, Technical Analysis, Elliot Wave Theory and actual Economic Indicators. No biased sentiment or sides.


#1 Chart shows an attempt to rally and pierce through 12700 resistance upon winning of Pro-Bailout candidates in Greece. Then next Major resistance is at 12880, where equivalent to 1360 for SPX. This is the major resistance of 1360 in technical terms. DOW and SPX chart isn’t the same at this point in time,making technicals check both charts to predict things more accurately.


#2. Chart shows a disappointed result and is attempting to resume the downtrend channel and attempt to pierce through 12000-12100 important support.

My only concern on our current economy is the Low Crude Oil, Commodities are usually good indicators in forecasting long term output in market, but Crude is has lost already 27% form the April Top,and is only crawling around 82-84 this week..


Monday, June 11, 2012

VIX and DOW Update 6-11-2012

One alternative Indicator to gauge Traders behaviour or Fear Level is the VIX.

This is one of the latest technology or indicator used by professional traders, aside of NYAD and GOLD:DOW ratio.

VIX usually shoots up 3-5% in a day when traders FEAR the markets, now Spain bailout was announced, and VIX dropped 5% to 20s level.

There are certain levels when people are too bullish and too bearish. There is a good exit and buy opportunity using this. Please see below.

Although recent 10% decline shoot up only to 25 level in VIX. Far from BUY signal at 40 and above, the FED and ECB fastly cut off the negative vibrations, thus cutting VIX as well. Well in the case it happened again like in Oct2011 lows, Vix hit 40 and above, and Weekly RSI at 30.0 below, who wouldn’t BUY into the markets.

Good Luck.


Posted Bullish DOW at Super Bearish DOW forecasts as well in technical terms.

BULLISH and current count:
BEARISH:

Wednesday, June 6, 2012

Buffett Sees No U.S. Recession Unless Europe Causes It-Bloomberg News

Warren Buffett, the billionaire chairman of Berkshire Hathaway Inc. (BRK/A), said he expects the U.S. economy to avoid another recession as long as Europe can contain its debt crisis.

There won't be a recession "unless events in Europe develop in some way that spills over here big-time," Buffett said yesterday at the Economic Club of Washington, D.C. He answered questions from David Rubenstein, co-chief executive officer of Carlyle Group LP (CG), the world's second-largest private equity firm.

Europe's sovereign-debt crisis threatens to destroy the region's 17-nation currency union. Finance ministers and central bank governors from the Group of Seven economies agreed yesterday to coordinate responses to the crisis as Greece contemplates leaving the euro. European leaders need to resolve some of the union's weaknesses, Buffett said.

"They're in on a common currency but they're not in on a common fiscal policy or a common culture or common labor practices," Buffett said. "They have to reconcile some of these things."

U.S. employers added the fewest workers in a year in May and the economy expanded at a 1.9 percent pace in the first quarter, government reports showed last week. Buffett has been building Berkshire's stock portfolio and making capital investments at the company's railroad and utility units as he bets on growth in the U.S.
Berkshire's Leadership

Buffett, 81, who is also CEO of Omaha, Nebraska-based Berkshire, has been preparing the firm for his eventual departure. He told shareholders in his most recent annual letter that the board has a candidate for CEO and two backups, without naming the executives. Vice Chairman Charles Munger is 88.

Berkshire is "in perfect shape," Buffett said at yesterday's event. "We've got successors that are, in most ways, better than I am."

Buffett has said that his roles would be divided upon his retirement. His son Howard Buffett, a farmer and Berkshire director, would be an effective non-executive chairman, Buffett has said. Berkshire has hired former hedge fund managers Todd Combs and Ted Weschler to help oversee investments.

Buffett announced in April that he'd been diagnosed with stage 1 prostate cancer that is "not remotely life threatening." He said he planned to begin a two-month treatment of daily radiation in July. The regimen will restrict his travel without otherwise changing his routine, Buffett said.
Buffett's Deals

Buffett built Berkshire over four decades by acquiring businesses including car insurer Geico Corp. and betting on stocks like Coca-Cola Co. His firm has amassed an $89.1 billion portfolio of equities, including a stake in General Motors Co. disclosed last month and International Business Machines Corp. shares acquired last year for more than $10 billion.

Berkshire spent $26.5 billion on the takeover of railroad Burlington Northern Santa Fe in 2010, a deal Buffett called an "all-in wager on the economic future of the United States." His firm acquired engine additive-maker Lubrizol last year for about $9 billion.

"I'm looking for one good idea a year," he told Rubenstein. "We're in June, incidentally, David, if you want to help me out."

Individuals should invest in index funds every month and avoid betting on specific stocks, Buffett said.

"The average person who just consistently buys equities -- which to me are by far the most attractive investment choice around -- at the end of 20 or 30 years, they'll do very well," he said.

Business at Berkshire's units can provide Buffett with a gauge of economic growth. At the end of 2011, Berkshire units, which range from insurers and retailers to a provider of luxury air travel, had 270,858 employees. That was up from 260,519 a year earlier, according to the company's annual reports. Employment at Burlington Northern grew by 1,000, while builder Clayton Homes cut 466 jobs amid the deepest housing slump in seven decades.

To contact the reporter on this story: Zachary Tracer in New York at ztracer1@bloomberg.net

To contact the editor responsible for this story: Dan Kraut at dkraut2@bloomberg.net


Tuesday, June 5, 2012

Global Market Snapshots (HK,AU,Korea,China, Germany, London, US)6-5-2012


Update#6. DOW SPX, breathing below important support


Last week, DOW, SPX and Nasdaq broke below important supports:
1. 200MA
2. Elliot Wave Theory having 1292(SPX), 12230(DOW) as important support to remain bullish and cant overlap.
3. Wave supports 1292(SPX), 12230(DOW) as former resistance last Oct2011.

All over the globe, selloff has already been massive and deadly, making Regions lose double digits.
Europe - 20%
Asia - 15%
US - 10%

Mixing all the Technical Analysis, Elliot Wave Theory, Fundamentals (Unemployement, Factory/Machine Orders) and Leading Technical Indicators (MACD,RSI, Volume, McClellan,VIX). The break below from important support makes it a semi-bearish sentiment on this market, they need to get above the 1292 and 12230 as soon as possible to have positive bias. For now, 50% chance bullish, 50% chance bearish.

There is sooo many count made by various EW analysts, and they are also in a 50-50 state to lay down this current market. Hopefully, the 50% chance of Bullishness remains.

Bullish Analysis and more Reasons to be bullish (50% chance):


Semi-Bearish Analysis (30% Chance)
Super Bearish Analysis (raised to 20% chance)

Friday, June 1, 2012

Intraday Fall from 1292 SPX important support 6-1-2...


It is now 948am EST, and first hour of trading, Global Markets gap down by 2%. Making SPX fall below important support of 1292, and DOW of 12231.

In these type of markets, professional traders and emotional traders battle themselves and produce huge selloffs or net buying, at this moment in time, Employment was below forecast, and panic sellers are pushing the red button.


I don't know how deep and where will we head next if we fall below 1292. But I am still hoping, that this intraday low at 1285 on SPX is just a "BEAR TRAP",and need to close the end of the day as close to 1292. To stay sideways to bullish.

Today is an important day for Global Traders, Billions of Dollars in TUG-OF-WAR, who will win.

I am hoping for Bulls to win... Hoping the Positive Divergence on MACD and RSI for DOW and S&P to confirm that this could just be a bear trap.. Crossing my fingers..

Saturday 6-2-2012 update: SPX was not able to hold above 1292 closing :( Instead, a huge gap down to 1278... We give early next week a chance to get above 1292, to say its still a false breakdown and didnt break the Elliot Wave rules. Else, this would spark easy 100-200 more declines in the market. Positive Divergence formed on Daily RSI MACD for SPX,DOW and Nasdaq, WTIC also hit 83.00, an important uptrend support. Elliot Wave suggests also that 5 waves down has been completed, and short term rally is due. Short term rally should get above 1292, and not just hit 1292 as a resistance to stay uptrend. Goodluck