Wednesday, June 27, 2018

Gold – bull market or just a bear market rally (repost from Tony Caldaro)

Gold – bull market or just a bear market rally

Posted on July 31, 2016 by tony caldaro
While many are touting a new bull market in Gold, and Silver for that matter, history suggests otherwise. When we look back at the history of commodity prices for the past two centuries we observe generally short bull markets followed by longer bear markets. Since Gold was fixed for most of this period a chart going that far back would be of little use.
CRB history
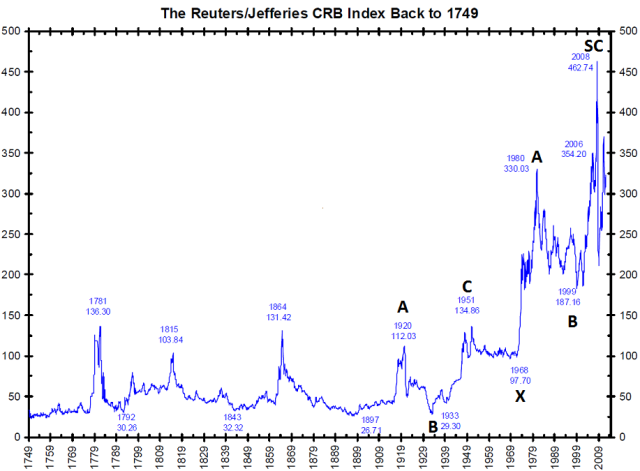
Notice for over 200 years commodities remained in a trading range. Demand drove prices up, then oversupply brought prices right back down. This all changed when the US went off the Gold standard in 1971. Commodity prices soared, along with Gold, and the bull/bear cycles became more uniform.
GOLD1970
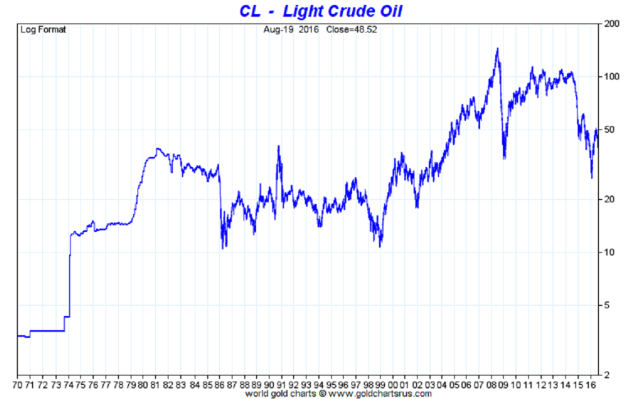
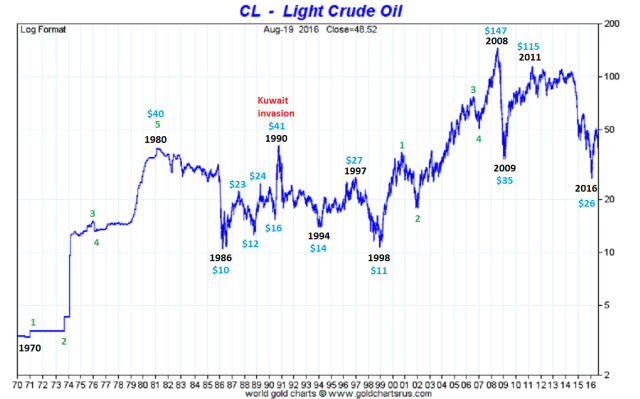
Gold has had two bull markets since then: 1970-1980, and 2001-2011. In between was a lengthy two decade bear market. The same pattern, with slightly altered dates, can be found in most of the commodities. For example, Crude had a bull market from 1970-1980 and another bull market from 1998-2008. In between was a lengthy two decade bear market. And Crude is currently still well below its bull market high of $147/bbl.
GOLD1980
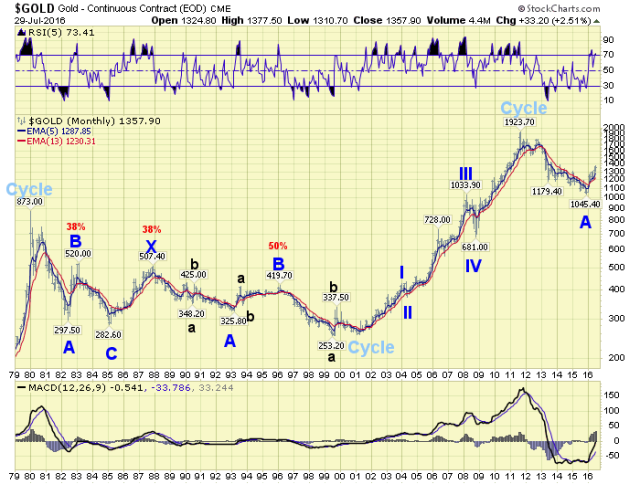
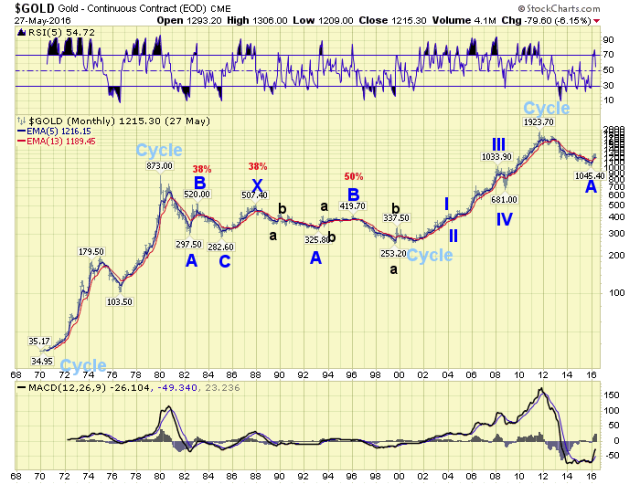
When we examine the last Gold bear market in detail we find it had three significant rallies during its 1980-2001 bear market. One in the early 1980’s, another in the mid-80’s, and the third in the mid-90’s. The first two rallies retraced only 38.2% of the previous larger declines, and the last retraced about 50%.
GOLD2011
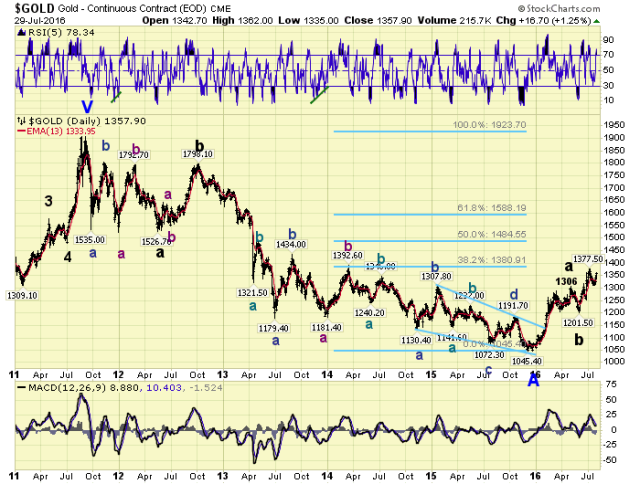
If we then apply these retracement levels to the current bear market rally we arrive at some interesting potential price targets. A 38.2% retracement of the entire 2011-2015 decline is $1381, and a 50% retracement is $1485. Since Gold has already risen to $1377, and if it clears the $1381 level, the 50% retracement level is probably the target. If we then compare the three waves within this advance we find that Major C equals Major A at $1463. This gives us an upside target for the entire bear market rally between $1463 and $1485 in the weeks and months ahead.
This is just an observation based upon historical and current wave formations, and not a trading or investment recommendation. You can follow Gold along with us using the following link: https://stockcharts.com/public/1269446/tenpp/10

All information were from Tony Caldaro.
Reposted to share the information.

Crude and the Commodity cycle (repost from Tony Caldaro)

Crude and the Commodity cycle

Over the years we have written many times about the 34-year commodity cycle. Generally commodities rise as a group in a 13-year bull market, which is followed by a 21-year bear market. Each specific commodity has its own particular cycle which generally fits within the broader 34-year commodity cycle.
A bullish phase of this cycle started about two decades ago in 1998, and ended in 2011. A bear market, lasting about 21-years, has been underway since then. Sorry gold bugs! During the bull market phase some commodities rise in five waves. During the bear market phase all commodities decline in three larger waves. Naturally, just like there are corrections in bull markets, there are rallies in bear markets. Commodities, in general, are currently in one of those bear market rallies.
Crudeblank
When one looks at a Crude chart covering nearly 50-years, one can clearly see two periods of rising prices and two periods of declining to sideways prices. While these rising and declining periods may look sporadic, they are actually quite regular when one knows what to look for. As we will explain in the following chart.
Crude
The two rising periods were actually five wave 10-year bull markets, i.e. 1970-1980 and 1998-2008. These two bull markets were separated by an 18-year bear market, i.e. 1980-1998. The rise during the bull markets were quite spectacular. Well over 1000% in such a short period of time. Price rises like these always lead to excess-capacity events. And these events are normally followed by nearly as spectacular declines. Which eventually cuts capacity until supply/demand reaches an equilibrium. We are in one of those equilibrium periods now.
With Crude 8-years into its bear market, and at least a decade away from starting a new bull market, we can already see a pattern unfolding which is relative to its previous bear market. To see this pattern one needs to review the larger waves first. During the last bear market Crude declined from 1980-1986, rallied to 1990, then declined from 1990-1998. A 6-year decline, then a 4-year rally, followed by an 8-year decline.
Since the current bear market just had an 8-year decline, 2008-2016, we should look into the last 8-year decline. Then the 8-year decline unfolded in three waves [1990]: 1994-1997-1998. Now the 8-year decline has also unfolded in three waves [2008]: 2009-2011-2016. Notice 1990: 4dn-3up-1dn, and 2008: 1dn-2up-5dn, nearly the exact reverse or mirror image. If we consider this a completed pattern, and we do, the next thing that should occur is a choppy 4-year bear market rally, i.e. 1986-1990 or 2016-2020. Therefore the $26 low should be the low for at least the next four years.
How far could Crude advance? During the last bear market all rallies, excluding the aberration from the Kuwait invasion, retraced 38.2%, 50.0%, or more of the previous larger decline. This suggests an upside target between $70 and $85 by the year 2020. Then, after that, a six-year decline into the final bear market low, which should be around the $26 area. In summary one should expect a price range between $25 and $85 over the next decade. Unless there is a supply-event, which could push the upper range higher.
All information above were from and property of Tony Caldaro.
Reposted to share the information.

Tuesday, June 26, 2018

Philippine Preferred Shares as of 6-27-2018

Updated as of 6/27/2018

The following are the current available Philippine Preferred shares and their updated call dates:

PRF2A - Petron Preferred 2A series - 5.67% NET - Quarterly*
PRF2B - Petron Preferred 2B series - 6.1725% NET - Quarterly*
PFP2 - Purefoods Preferred - 5.09% NET Quarterly*

MWP - Megawide Preferred - 6.3225% NET Quarterly*

SMC2A - SMC 5year - 6.8% net Quarterly* (REDEEMED - not traded anymore)
SMC2B - SMC 7year - 6.975% net Quarterly*
SMC2C - SMC 10year - 7.2% net Quarterly*


SMC2D - SMC 5year - 5.35% net Quarterly*
SMC2E - SMC 7year - 5.692% net Quarterly*
SMC2F - SMC 10year - 6.13% net Quarterly*


SMC2G - SMC 5year - 5.921% net Quarterly*
SMC2H - SMC 7year - 5.69% net Quarterly*
SMC2I - SMC 10year - 5.70% net Quarterly*


FGENF - FirstGen F Shares - 7.2% net Semi-Annual*
FGENG - FirstGen G Shares - 7.0% net Semi-Annual*
ACPB1 - Ayala Preferred - 4.725% net Quarterly*

ACPB2 - Ayala preferred - 5.0175% net Quarterly* 
Globe something - 4%(not sure) SEMI-ANNUAL*

PNX3A - Phoenix Petroleum Series 3 - 6.685% net Quarterly*
PNX3B = Phoenix Petroleum Series 3 - 7.425% net Quarterly*

DDPR - Double Dragon 5.83% net Quarterly*

GTPPA - GT CAPITAL  4.167% net Quarterly*
GTPPB - GT CAPITAL   4.585% net Quarterly*

ALCPB - Arthaland Preferred B - 6.34% net Quarterly*


DMPA1 - Del Monte $ USD preferred
All are listed in the Philippine Stocks Exchange and be tradable until their call date. *Percentage(GROSS/NET) are per annum basis., Quarterly and Semi-Annual written down are dividend payouts per year.

Call Dates listed below*:


2017, SEPT - SMC2B 5th year OPTIONAL redemption and may call anytime
2018 - SMC2D 3rd year OPTIONAL redemption and may call anytime 
2018, MAR - PFP2 3rd year OPTIONAL redemption and may call anytime
2018, JULY - Mandatory Call Date of FGENF

2019 - ACPB2 5th year OPTIONAL redemption
2019, SEPT - SMC2C 7th year OPTIONAL redemption and may call anytime
2019, NOV - PRF2A Mandatory 5th year Call Date 
2019, DEC - MWP 5th Year Optional Redemption - MAY CALL ANYTIME(Tax Event,Taxation)  
2019 - SMC2G 3rd year OPTIONAL redemption and may call anytime

2020 - Mandatory Call Date of SMC2D (5th year)
2020 - SMC2E 5th year OPTIONAL redemption and may call anytime
2020, MAR - PFP2 Mandatory 5th year Call Date
2020 -  PNX3a 5th year OPTIONAL redemption and may call anytime

2021, NOV - PRF2B Mandatory 7th year Call Date
2021- Mandatory Call date of ALCPB1 (5th year) 
2021 -  Mandatory Call Date of SMC2G (5th year)
2021 -  SMC2H 5th year OPTIONAL redemption and may call anytime
2021 - Mandatory Call Date of GTPPA(7th year)
  

2022 -  Mandatory Call Date of SMC2E (7th year)
2022 -  SMC2F 7th year OPTIONAL redemption and may call anytime
2022, JULY - Mandatory Call Date of FGENG
2022, SEPT - Mandatory Call Date of SMC2C
2022 -  Mandatory Call Date of PNX3a (7th year)
2022 -  PNX3B 7th year OPTIONAL redemption and may call anytime

2023 - ACPB1 10th year OPTIONAL redemption
2023 - Mandatory Call Date of GTPPB(10th year) 
2023 - Mandatory Call Date of DDPR(7th year Optional Redemption) 
2023 - SMC2I 7th year OPTIONAL redemption and may call anytime

2024 - ACPB2 10th year MANDATORY redemption 
2024 - Mandatory Call Date of SMC2H (7th year) 

2025 -  Mandatory Call Date of SMC2D (10th year)
2025 - Mandatory Call Date of PNX3B (10th year) 

2026- Mandatory Call Date of SMC2I (10th year)


2028 - ACPB1 15th year MANDATORY redemption 


* listed rates and month/year are the calendar dates I know, please verify exact rates, day, month and year if needed. 
** All have closure that they may extend the Mandatory Call date + some additional %

Thursday, June 21, 2018

[Bear Market Special] PSEi Philippines 6-21-2018


Short Term Chart

Updates from our trades:

We entered 7,550 last May 2018 which eventually broke out of the declining phase. PSEi rallied strong and reached 23.6% fibonacci retracement, a good bounce of 5% gain.

We had a target of 38.2% fibonacci around 8000 level to close our trade, but shit happens. Well it was still a nice trade since we avoided the 9000 to 7550 drop (19.2%).

From a good upward movement, PSEi broke down its decending channel and broke below its medium term support.

Until now, we do not execute any trades. The position we took last 7.550 was only around 10% Equity Portfolio and the BSP did not take any quick action with regards to the interest rate hike of US. Foreign firms continue to dump our PSE index and most probably shorting it. Yesterday's 0.25% interest rate hike in PHP is too late already to rescue our index.

In layman's term, don't catch the falling knives YET. Look for possible support.


Medium Term Chart:


Since the "NEWS" call this aka Bear Market. with the reason that market already corrected 20-25%. We can safe to say that we technical traders join them as they speak, as we broke below the 2009-2018 uptrend line.


Long Term Chart

Long Term Chart also shows that this dive can hit really hard.

1st minor support 7000-7100
2nd support at 6500-6600
3rd major support (38.2% fibonacci of 2009-2018 bull market) -  6000-6200


All I can say is that, from my 10years of trading, this is a good opportunity for us to learn that stock market do not go in 1 direction, they also experience the typical correction or at most a bearish case scenario.

I am not a bear, charts above show us that worse is yet to come, and we should prepare for it. As good entries lead to fruitful returns.

Strategy Tips for this medium to long term correction:

1. Look for entry points where foreign sellers stop or pause. (sideways pattern)
2. Try to wait for BSP to ease the USD to PHP (53.30 as of 6-21-2018), cheaper USD will lead to better PSE index.
3. Don't be afraid to invest in these times, patience is the key.
4. Collect as may cash as possible, so when a good entry point appears, invest 10-20% of your portfolio. Do not place ALL IN in a single trade.
5. Diversify.

* My own target: I am gladly welcoming 38.2% retracement (6000-6200) before trying to trade this market with these reasons:
1. PSEi is still around 19x PE ratio (expensive in Asia)
2. US (DOW and SPX) are still trading near all time highs, what more if they broke down as well
3. USDPHP should be around 50pesos or below to make investing in PSEi valuable again.
4. Bear Market correction lasts around 6mos to 2years.
5. Bull Market in the world is now at 9th Year.

** Rally anywhere from 7350-7550 is a SELL. Foreign companies will not come back soon I believe.

So be patient and live happy!