Monday, September 26, 2011

DOW Daily,DOW Weekly, HSI, China, London 9-26-2011


DOW Jones is in a very critical stage at the moment, we are in a trading range, where it was initinally an uptrend line, but went to the weekly low at 10700. There are 2 possible scenario at this moment, a breakout of the range can bring us to a 117000-12000 level where we can have a chance to sell, or the doomsday scenario of breaking down into the 10700 support, and has a target downside of 9700.

At this point in time, Asia market is very very weak and far away from the GDP its generating, Asia should be the White Knight here, and defend that even a Greece Default happens, Asia Market will bring the global economy up, but now, what happens is that, Asia is even more scared by the European Debts.

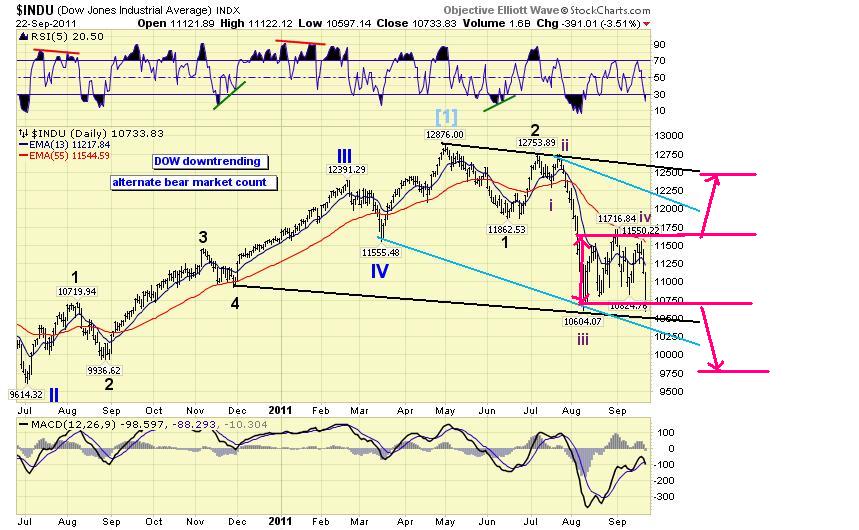
Medium term: DOWNTREND
Short Term: Trade the range (But I prefer not to trade, very risky chance to Win a trade, just wait for a higher ground to sell more stakes)


On the weekly charts, we are illustrating an Elliot Wave Theory, that states and projects the target downside and rally. Now, its currently in the possible Wave 4 of Primary Bear market A, or a Primary Bear Market Rally B. I hope its the PRimary Bear Market Rally B, so I can get out more of this market, before we see new lows.

Summary: Any count, either Choice A or Choice B, suggest that there is a new LOW coming soon.


HK Market... My Favorite Market, but is Outperforming and making a lot of people lose money. This is should be one of the "safest investment", since GDP here is so good, and Earnings of the companies has a very low P/E ratio of 8.0, this is a very cheap market, but is still on a very steep downtrend line.


China Market is also one of the Outperforming markets, closer to the 2007 lows compared to any other Market in the world (Except problematic European Countries). With a Country that reaches 10% GDP, how come their market is as stagnant as Europe? I know they have 30% of their wealth invested in Greece/Europe. So maybe that's one of the reason that China Equity Market is unhealthy.


London... The Trading capital of Europe. After we confirmed last week that Germany enters recession with the very important breakdown on its critical support. Looks like London is going to follow..

We are projecting that a possible VERY BIG Head and shoulder pattern is forming, and has a downside target of 3500 (A Double Dip Recession compared to 2007).

With the projection, Charts dont tell the truth, but does not tell lies either. This FTSE London Chart suggest/gives a hint that a Greece/European Default is very highly probable.

Friday, September 23, 2011

PSE confirmed Head and Shoulder Pattern, downside 3700-3800 9-24-2011


Since the Downgrade of U.S. last couple of months ago, we already advised everyone to convert everything into CASH and not GOLD (since Gold may be in a parabolic bubble as well) Silver,Copper and other metals as well.

Our earliest post that gave everyone a warning was as early as Aug 15,2011 (http://theamazingchart.blogspot.com/2011/08/might-be-warning-for-pse-8-15-2011.html). Where we forcasted a possible Head and shoulder formation forming with a downside target of 3700-3800. And just this week, it dropped the very important neckline around 4150! And it happened as what was expected!

I hope everybody took my advise on this expected PSE behavior, and are in a Cash state right now. I also feel that I am one of the few who are really concerned about PSE, as most of my friends have more than 70% in the market, and still playing PSE for August and Sept. Honestly, I did NOT trade any since I got out of the market last Aug.

Having 75% cash out since Aug, I am happy, yet unconontented retaining 25% equity exposures (due to my bullish friends NOT believing my forecast), that lost a lot of value this week!. Still, im looking on a bright side, I can buy so cheap Stocks with my 75% cash. No regrets at all!

PSE support at 3700-3800. Next is at 3550,3300,3100. If Greece will default, 3100 for PSE is highly probable and a good buying point :)

Thursday, September 22, 2011

Period of uncertainty 9-22-2011

I just came back from an out of country vacation, arranging my accounts overseas.

All the time i found any wifi hotspot, i try to open up my account and check global market, the last 2 days, its following our elliot wave count of up to 4% correction, then a huge rally or sustainable rally to end to 11700-11900 level to finish the major wave B , before any turmoil continues on this so called "possible bear market"

I give the 11700-11900 the chance to get out of the market, its only the most advisable way to avoid huge flactuations on daily market basis. For the past 120 days, more than 75% of the time, has more or less than 100 pts gain or drop in a day. This is a good strategy for day traders, but is not for a long term investor. Your're seeing a 2% gain today, tomorrow the 2% gain is taken back from you.

I still hope that in the next days or weeks to come, there is agood opportunity for all us people to get out of the market and relax from this turmoil market.

For PSE, im seeing the late effect, looks like the projected drop of 3850 is now very highly probable. That's my best and easiest decision this 2011. To get out of the PSE market during the 4500 peak.

I am very sorry for this quick update and no chart to upload, still busy and will try to provide more charts on my next posts, just remember, a drop below 10700 will invalidate our expected major wave B rally by end of sept of early Oct.

Wednesday, September 14, 2011

PSE, Germany, Euro Dollar 9-14-2011


For PSE, I was less defying to recommend PSE index, since it’s the least damaged Index I known to be. Comparing to all daily selloffs on Asia, PSE is now on a very small range trade pattern, which I suggest not to trade since its very risky, and forming also a head and shoulder pattern long term for the entire PSE market, 4500 as the peak of the head, and currently in the shoulders, and may hit the neckline very soon once PSE drops below 4300, neckline is at 4150. A confirmation of the Head and shoulder drop has a low target of 3700-3800.

Since Early August, I’ve done a lot of selling, and now at 75% cash, sitting and drinking coffee(watching people trying to trade got whipsawed), still hoping for a good bounce to totally get out of the market. If Germany which is at P/E of 10, gets a 4% one day drop, and HK market P/E 9.5 drops 500 pts in a day, how come a 3rd World Country with P/E 15.5 just floats around like there is no bad news all over the world?! I doubt.. I really doubt.


Just 2 weeks ago, DAX(Germany) was shocked with a breakdown below its very critical support around 5500, which is the 61.8% retracement level of the Bull market from 2009-2011. Market recalled 38.2% of the gains in just few months time.

This is a very bad scenario, and very first Strong European Nation to get below its very important support, making Recession chance higher in medium term. Last Friday, It went on a battle to come back above 5500 level, to resume its Bullish state, but it failed… A more reason to avoid entirely on Europe Market, and Global Equity Markets. If Germany went down, what more to less GDP generating Nation, especially European Nations and including America and some parts in Asia.


Regarding currencies, The European Money aka. Euro which was introduced in early 2000 at 1.00. Is currently downtrending, hit 1.50 last May 2011 on a parabolic state, where I felt like Professional Traders used the chance to convert/abandon the deteriorating Currency.

Now it is on a huge downtrending channel, and more likely will go down further in months time. Can correct to 1.38-1.40 anytime soon, but may just be a selling chance. Overall, medium term, if this Downtrending channel don’t change phase, we expect EUR to be trading at 1.30-1.32 by Q42011 or Q12012. And 1.20s around Q42012. A possible Default of a European Bond might be the reason for this, and might impact more downturns if it happens. Euro at 1.0 anyone?

Sunday, September 4, 2011

Comparison on 2007 Recession, and continuation of Money Making Play of the Quarter 9-4-2011

In relation to my Money Making play last 2 weeks http://theamazingchart.blogspot.com/2011/08/bear-market-play-of-quarter-8-22-2011.html, I posted below the current status of our market projection.

** NOTE That I am not Bearish in this global market, its just that, there is a 70% chance that Bear Market will happen, Just playing the market safe, and nothing wrong to expect the worst things in this world.

In our First Scenario, I made a RED DOT in our forecast where we are in this market, This advanced count suggest that temporary correction has just happened (-2.20%), and is poised to see the 11850 resistance.


2nd Scenario, market is not yet enough on the downside, and just breached 11500 resistance to take a pause before hitting new lows, after that, we assume still to resume back a temporary upside correction up to 11850 level, before continuing the Bear market selloffs.


Now that most are unaware of Bear Market Counts, I have illustrated below, a Bear Market example last 2007, and comparing the count we have right now, I made a RED DOT where count suggests how high we are still right now in a BEAR MARKET scenario.
1st dot - 2nd scenario above
2nd dot - 1st scenario above

And still, a suggestion of unloading of equity exposures on the 11850 level or so.


Death Cross - an intervention of a Simple Moving Average (SMA) 50 and SMA-200.

In Tony's post, he uses Exponential Moving Average (EMA) 13 and EMA 34 on a weekly chart.

Both are useful, and just minor adjustment to make charts as clear as possible.

Death cross is usually a Bear Market or Bull Market signal, that once a SMA-50 breaksout of a SMA-200 downward line, it Signals a Bull Market rally coming, and Vice Versa.

Now the chart below is a history example of what happened last recession.

2003 - A good GREEN Bull Market sign
2007 - a RED Bear market sign.

At the current status of our market, it is still deciding which side to go. And I still personally put the numbers 70% chance Bear, 30% chance Bull.