Tuesday, June 28, 2011

Greece Greece Greece, putting Grease in Europe

Since I dont have any news for all of you guys, and its the most boring days of 2011. Stocks are just pulling up and down, getting 1% gain and swiping all the gains another day.

One thing I have noticed is that the support of dow at 11800 has got a short term double bottom, with Positive divergence on the daily charts, which really indicates a good signal that bottom may ended already. ( lazy to put charts).

Also, I found one good article by my CNBC Idol, Mr Jim Cramer, though sounds bearishly looking, good article to read.
----------------------------------------------------------------------------------------------------


Should Greece default on its debt, some fear Europe will implode. It will create an Armageddon-like scenario that many suspect will be similar to the collapse of Lehman Brothers.


For his part, Cramer said Thursday he doesn't think that will happen. He thinks France and Germany will work with the International Monetary Fund to avoid another Lehman-type situation. But the "Mad Money" host wanted to use an up day to discuss just what the "Chicken Littles" are fearing. In other words, he discussed what the worst case scenario would look like, even though he doesn't think it will happen.


First, Greece defaults and everyone stops buying bonds around Europe, including those from Ireland, Portugal and Spain. In turn, those countries default, too. Like Latin America in the 1980s, huge amounts of debt are cancelled and re-issued in the form of bonds nobody wants.


Second, the hit takes out foreign banks and we learn they had insured the government paper and the bank paper went under. It would be the European equivalent of Lehman, Bear Stearns, AIG and the like. These banks are closed or merged by the surviving countries' financial institutions. It could also be that they are nationalized outright with all common stock, preferred and corporate bonds wiped out, though the customers' accounts are preserved.


Third, huge layoffs sweep Europe and the Continent is thrown into another recession because so many banks are made insolvent by the insurance contracts they offered to struggling governments.


Fourth, Europe's recession pulls down the USA because of the tie-ins and because two or three U.S. banks had hidden exposure to Europe. The U.S. learns about the exposure too late because there still is not enough transparency and U.S. banks are still buying and insuring un-insurable risk over there. These banks are merged with healthy banks that have raised a lot of capital, but the stocks get hammered to their 2008 and 2009 lows.


Fifth, massive layoffs strike the U.S. because of Europe. The U.S. economy wasn't growing anyway, though, and the country is sinking under the weight of higher commodity prices, Washington dithering and a president, who has failed to create jobs. As the U.S. continues to sink, commodity prices plummet and construction stops due to weak demand. The industrials take a beating every day.


Sixth, money flows from risky assets to high-yielding companies that weren't' high-yielders all that long ago. Safety stocks rally because commodities collapse and margins widen. This move happens on the way down, even as corporations were prepared for the downturn. The cyclicals don't get much love, though, and fall to their 2008 and 2009 levels, as well.


Seventh, new defensive plays emerge. These stocks do well because they don't need growth. Food stocks will also do well because commodity prices have been crushed.


Eighth, because commodities have collapsed, China stops tightening and wage inflation ends. That stems the decline in industrials that have been pummeled because of fears of Chinese tightenings. These stocks can be bought with 4 percent yields.


Ninth, companies fall back to cash levels. People think that their earnings are going to collapse because of the recession. These companies can now be bought with 5 percent yields.


Tenth, the U.S. employment rate skyrockets past 10 percent. People leave the market in droves and stocks go to price-to-earnings multiples of 10 or lower. But being as the earnings aren't there, the multiples are really about 15 or so.


All said and done, it adds up to a near 63 percent pullback of the entire 6,000 point run in the Dow. The average could touch the 7,500 level, where there would be bargains galore, even though nobody would want them.


So if this plays out, Cramer noted it wouldn't be as bad as 2009. But it would be bad. Still Cramer's not buying into any of this. He actually thinks we're closer to a bottom than we are to a top.


Monday, June 20, 2011

Weekly Updates (WTIC,Dow,HK,China, PSE 6-20-2011

Haaaaayyyyyy! Gains blew Away!

This European problems has been giving us a lot of headache. I still believe, the current solution for Greek Bailout will just be temporarily and be a bad decision for long term.

As what I have said last time, Commodities also play huge in accordance with the stock market, WTI Crude just went to 92.xx today this opening bell, and we SHOULD be expecting a 2.00 roll-back from gas/diesel prices, what the hell is wrong about them? SO fast in increasing prices, yet not reactive when price drops in global market.

Like Dow Jones, WTIC is also very near to its 90 support, a breakdown of this market would also give huge impact to Global markets. So a bounce to 90 USD, and a bounce to 11500-11700 of Dow Jones would be needed in order for this bull market to continue.

To European IMF: Just lend more money to Greece, with due of 2013-2014. Let us manage to get out by 2011 or 2012 and never look back before this crisis looms.


I may be saying, we did only a 7.5% correction from the peak. As much as possible, I want to wait for the 11500 support, but its really affecting the Asia Economy! Please see below for more info about Asia.


Europe's one of the top 10 investors is China/HK. Maybe the reason that is has dropped more than the U.S. region is that they have more exposures, remember that China is investing more into European Debt and has Greek Bonds ( not sure about the value).

HongKong is poised to breakdown into its short term downtrend and facing the long term Uptrend Line, which should not fall below, or else, this 12.0 PE Ratio (cheap looking), must be pushed up soon or we see great danger here.


China's GDP is still 8.0% and up, what the hell is wrong in this downtrend since 2009? Maybe part of European Exposure, but for me, they should be better than what we are seeing right now.


For PSE, still biased, im avoiding this market, what I've seen in the Asia Region, is enough said that price in PSE is on the "overpriced" side, im looking better into Asia Region with huge discounts, than with PSE market, will no traders willing to sell at an overpriced state ( For Global Traders, you know what I mean, for PSE-only traders, please try to take a look on a Daily basis on Asia , Europe and U.S. Countries also, will help you decide if how Other Countries react in their Equities :) ).

PSE is just well over 8% from the All-time-high. I'm joining the bears temporarily and wait for good correction to the 3xxx level :)

Thursday, June 16, 2011

Bull Market Forecast: possibly to end in early 2012 6-16-2011

In my spare time, watching stocks and global equities go down, I was just thinking and analyzing what this chart can go in terms of months from now.

I may not be the best out there to predict what will happen next, but applying Elliot Wave analysis Theory, I was having fun making a new alternative count in accordance to Tony Caldaro's expected end of bull market in 2012.

From my chart below, I was just playing around with his chart, and trying to analyze what count are we already in right now. The my standpoint view, the 11500-11700 is really very very near and we could already rally or maintain the tradable sideways where people still make money, rather than the 1.5months continuous drop where everybody burned cash.

Just my hitch, I created my count below, with the help of Tony Caldaro's updated chart, I was expecting this "alternate count" to be in our Primary Wave IV correction already, the Primary Wave II correction last 2010 lasted 1.5-2months, so might be the current status of our market.

Applying this very short Bull market and Elliot Wave concept, we may be at the fastest phase of a bull market (ranging 2-4years), With not enough growth to economy, China having Trillions of Investment to Europe, U.S. and Asia also have exposures to Europe, It is good to be bullish and optimistic, but like a Domino, if one falls, so will be the others - it would really make a big hit to the global market. After this expected long correction, I am expecting another 5 intermediate waves of rally to complete the Primary V rally until early 2012 (estimate of DOW 13k-13800)

In my own opinion, it may be correct, since Stimulus will cool down, and European debts will go crazy, its just my own "alternative count", and I will be using this guide to play this market till 2012. After that, we might see the slowdown or Europe will enter recession. Its still not end of the world, we can still make easy money, but need to have a very cautious one.

Stock Snapshots: FGEN,EDC,RCB,BDO,MEG,MPI, AGI 6-16-2011


Tuesday, June 14, 2011

PSE Market quick update 6-14-2011


PSE Market is now one step away from falling into a deep cliff. the 4130-4160 support act as the very little steps away from dropping into the 3900-4000 level.

If Global market continues to selloff, I would not be shocked if PSE drops down, as many of our stocks, MER,JFC,ICT has been into SELL rating by various firms due to high P/E ratio.

Still no momentum gains from PSE, but anyone can dare to range trade this, we might not know, maybe 4130 is the strongest support already and we are set off for a 4330 rally again. THEN, if it falls below, CUTLOSS/HOLD and accumulate near 3900-4000 level.

Monday, June 13, 2011

Market Snapshots: AU,HK,Germany,China, Crude Oil 6-13-2011

Global Equities is now at a net of 7.5% from the peak, its been 1.5 months already since hitting the 2year high. Sadly, Global Equities especially U.S. Market broke down its 12150 support that continued this sell-off, though considering the fact the we are down huge from the top, I expect this market to strongly hold at the Medium Uptrend around 11500-11700, and RSI for weekly charts is oversold already.

"We can't avoid European Debts, I personally object to the Debt Restructuring in Europe, this will just prolong the Crisis, this will persist until a Major Bond Default happen near 2015 (planned IMF targets)- we have no choice but to sweep off their Debts,will hurt Investors,but can help them start clean but LOSING their Reputation. We should still be confident with strong earnings our stock/Market has (U.S.,Asia), be cautious still, but there are double digit returns when one enters in a perfect timing" - Mike of TheAmazingChart.blogspot.com

HongKong


China


Australia


Germany


Crude Oil


Charts belong to Tony Caldaro of caldaro.wordpress.com

Wednesday, June 8, 2011

Dow Jones daily,wkly and S&P broke its support.. 6-8-2011

I have no updates with regards to the PSE Market, it is the most boring days in months time... Can't help but just "wait" for PSE to go down. But it looks we were just joking around, getting +30 points today, then tomorrow -30 points, then +20 points, -20 points on the very next day.

For the meantime, There is a sad news for Medium term traders, Our Global economy aka U.S. Equities broke its important support.

Daily:

Weekly:


INDU or Dow Jones broke its 12150 support... Even if RSI looks very cheap, the very short term rally could just be a corrective wave, before another downtrend cycle begins.

I have drawn in ORANGE color the possible forecast and movement of the Dow Jones Market. A short lived rally to the 12350-12400 level could be a selling point for short term traders. As for the meantime, a selling pressure towards to the 11500-11600 Medium term Support is at hand.

For now, HOLD and SELL on Rally for short term traders. Or buy at 12000 level and make sure to sell at 12200-12400 level.

For Medium term Traders, accumulate and wait for 11500-11600 to get all in.


For S&P. Same with Dow Jones, it made an awful breakdown on its short term uptrend. It broke down the major 1300 level support, which is now overdue for a short rally.

I also drawn ORANGE lines for the possible reaction of the market, first a short rally due to oversold RSI, then a possible retest of the 1275 level, then if still dont hold, it can meet the major Medium term support of 1250.

Same as Dow Jones. But at 1280 level, and make sure to sell on the short lived rally.

HOLD and wait for more stronger support before getting back to the market.

Sunday, June 5, 2011

DOW daily,wkly, S&P daily,wkly and PSE update 6-5-2011


Euro Zone Debt fears still in the air, sending Global Equities to Negative Territory this month of May. Usually May is the one which we get positive gains.

The selloffs has been daily with a huge 2.5% last thursday, followed by an almost 1%. Making all Equities to a short term downtrend momentum, might be affecting also the Medium term trends if selloffs occur.

To my standpoint, I personally object others which are saying its downtrend already, I still have hope based on my charts that it may be the bottom already short term. I might be correct, may also be incorrect.

For now, I think DOW Jones got a support at 12150 level, with a very interestesting RSI of 35. Still waiting for further cooldown on EU Zone before sending a BUY. But looks cheap at 13.5 P/E ratio.


DOW Jones Weekly charts, sending RSI level to 52, Usually at Weekly Charts, BUll market correction usually stops at 40-50 level, before setting up the rally, here, hopefully it happens again. Must not set another selloffs as we are currently are at a critical level of Short Term and Medium term uptrend.

A fall below 12150 sends us to the Medium term uptrend support of 11400-11500.

I am trying to change Technical Styles for RSI levels:
For Dow Jones above : 14 days RSI
For S&P below: 5 days RSI

Still testing if 5 days RSI could be a better Technical Outlook forecasting tool.


Using 5 day RSI Level, S&P is now at an oversold level, As I've said, this RSI(5) is still on an observation stage if its more reliable to forecast future movements. Overall, S&P still uptrend ( Im still hoping that my charting is correct, some others already triggered a CUT-LOSS signal), a fall below 1300 will send us short term downtrend to a support of 1250.


S&P Weekly still in uptrend. A fall below 1300 short term uptrend (Green Line), will send us to a low of 1250 for the Medium term uptrend support. Also, using RS(5), it is triggering a BUY status with an RSI level of 29. Let us see further if we are correct. A set of EU Debt sell-offs will invalidate our current Observation.


PSE I believe is the strongest among Asian Countries. Thursday I remember, AU,HK, China has 2.5% down a piece, our PSE that time started in the negative territory and even closed .7% higher to the ground! I don't believe it.

Still I'm biased, not touching PSE as long as it touches the 4300 level and the 4330 Resistance. MACD has no signs of strengthening yet.

Trade the range of 4180-4330. Or at best - HOLD.

Saturday, June 4, 2011

Five Places Where the Bubble May Burst - Yahoo! re-post

Bubbles are a beautiful thing to watch while they're inflating or floating along, but they can be extremely messy when they burst.

The U.S. still hasn't recovered from the real estate bubble that burst in 2007. Considering the somewhat tenuous state of the second coming of tech spending, the bubbling costs of college inflation, the seemingly limitless heights of gold prices and the ever-expanding demand for health care as baby boomers ease into retirement, there may be another bubble just around the bend.

Don't tell that to Las Vegas, which is still trying to pick up the pieces after the housing bubble's pop shattered its real estate industry. Average home prices dropped from $220,000 in 2008 to just $128,000 in the first quarter of this year. As a result, a 3.21% foreclosure rate quoted for the area by RealtyTrac is still the highest in the nation. The good news is that foreclosure rate is a 11.54% improvement from fall of last year. The bad news is that it's only a 7.74% upgrade from the same period last year, is still costing more homeowners their properties than anywhere in America and is having a residual effect on business, with traffic down at McCarran Airport and once-untouchable businesses such as the Sahara casino closing, its owners cited the crisis as a reason.

The Street took a look at five regions that lean heavily on one industry and at just how much they stand to lose should their bubble be the next to go:

Lincoln, Neb.
Unemployment rate: 4.1%
Largest employer: The University of Nebraska

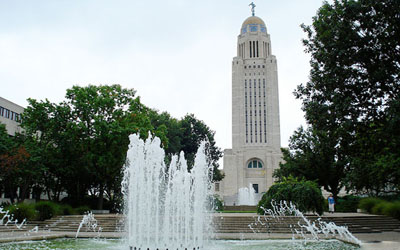
The University of Nebraska is the largest employer in Lincoln.
Photo: Tobias Higbie

As a state capital, Lincoln is usually shielded from the worst effects of bubbles and recessions. As with other state capitals, including Austin, Texas, and Madison, Wis., however, a big part of its stability comes from housing the state's university.

The University of Nebraska employs nearly twice as many people in Lincoln as the state government, and while it's a big part of the reason Lincoln's unemployment rate has fared relatively well compared with that of the rest of the country, it's could also be a weakness if higher education costs ever find a ceiling. According to the nonprofit College Board's annual study of college costs, the average tuition and fees at U.S. public universities have increased at an average of 5.6% per year beyond the rate of inflation. That includes a 9.3% increase in 2009-10 at the height of the recession. As enrollment at state schools rose 33% within the past decade, per-student appropriations dropped 19%.

When those institutions employ large swaths of a city's populace and are under attack, including from low-cost competitors among two-year institutions and a burgeoning online education industry, towns such as Boulder, Colo., Ann Arbor, Mich., and, yes, Lincoln have reason to be concerned.


Killeen-Temple-Fort Hood, Texas
Unemployment rate: 7.9%
Largest employer: U.S. Army

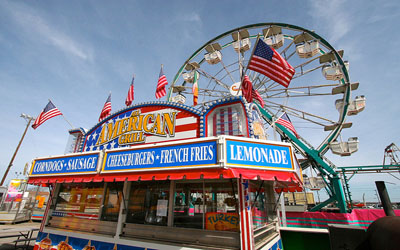
One way to amuse yourself in Killeen, Tex.
Photo: flickr|eschipul

Thinking Fort Hood is immune to military budget fluctuations just because the First Cavalry, 3rd Armored and roughly 65,000 soldiers, supporting staff and families call it home is like dismissing an Army without tanks. Considering the depth of cuts Defense Secretary Robert Gates wanted to make even before Osama bin Laden was killed, all options should be considered on the table.

With politicians from both parties discussing drawdowns in Iraq and Afghanistan in the wake of bin Laden's death, communities such as Navy-dependent Jacksonville, Fla., and Air Force base-adjacent San Bernardino, Calif., and Valparaiso, Fla., have reason to believe those conflicts and U.S. commitment in Libya represent a military spending bubble. Gates wants $100 billion to come out of the now $690 billion defense budget within the next five years, but the cuts haven't hit the bases so far.

While he's already "determined that we will not repeat what we did in the 1970s and 1990s, which is across-the-board cuts that end up hollowing out the force," ask the folks in Lima, Ohio, how seriously he's considering cuts. For those who know Lima only from episodes of Fox's Glee, it's also home to the General Dynamics' Joint Systems Manufacturing Center, which makes the M1A1 Abrams tank and the Marines' Expeditionary Fighting Vehicle. Gates wants to cease production at the plant in 2013-16 to save roughly $1 billion -- marking the first break in U.S. tank production since 1941.

Much of Gates' cuts are targeted toward weapons programs, but he has also called for shrinking the size of the Army and the Marine Corps and hacking the Pentagon budget down to less than 1% growth next year. With political sentiment shifting away from spending of nearly any sort as the U.S. hit its debt ceiling, military communities such as that surrounding Fort Hood shouldn't be surprised when those cuts hit home.


San Jose/San Francisco/Silicon Valley
Unemployment rate: 10.3%
Largest employers: A patchwork of technology companies

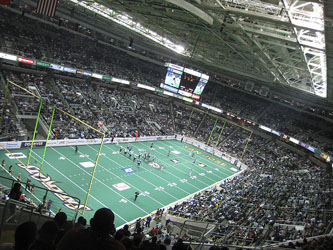
Arena football entertains the digiterati in San Jose, CA.
Photo: flickr|bryce_edwards

If any community knows just how quickly the tech tide can turn, it's San Jose. After the tech boom of the late 1990s pushed the Nasdaq to 5,132.52 in March 2000 and its subsequent collapse drove it to below 2,500 by that December, Silicon Valley high-tech industries dropped off by 17% and roughly 85,000 jobs just disappeared by 2008, according to the Bureau of Labor Statistics. Jobs in the Internet community, telecom and data processing alone declined 26% between 2000- 08.

San Jose, San Francisco and the rest of Silicon Valley are bracing for Round 2 as companies such as Farmville maker Zynga and Twitter are IPO gossip fodder while even mainstays including Google, Cisco and Intel are eyeing advances by Apple and purchases by Microsoft before making their next move. Though the amount of venture capital flowing in for the little guys last year is less than a quarter of the $8.5 billion that came rushing into Silicon Valley at the peak of the tech boom, according to Thompson Reuters, Tesla's IPO last year, the rising star of Facebook's still 20-something Mark Zuckerberg and the renewed presence of big money and big risk in the air still has locals and some investors nervous.


Pittsburgh, Pa.
Unemployment rate: 7.4%
Largest employer: The University of Pittsburgh Medical Center

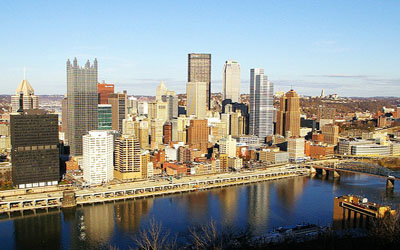
Pittsburgh's economy relies upon healthcare spending.
Photo: flickr|kla4067

It's almost a shame a town so hard hit by the industrial decline of the late 1970s and early 1980s has become a perfect storm of bubbles. The University of Pittsburgh is still one of the town's largest employers, the empty manufacturing facilities are being populated by tech startups and arguably the biggest employer in town is the University of Pittsburgh Medical Center -- which is, yes, separate from the university from which it takes its name.

The last may be the most volatile of Pittsburgh's three rivers of revenue, as Pittsburgh and other health care heavy towns such as Augusta, Ga., and Boston may not have to wait for the baby boomers to blow through to see their bubble burst. According to health care consulting firm Millman, American families insured through their jobs are racking up an average of $19,393 in health care costs, up 7.3% from last year.

In fewer than nine years, the cost of health care has more than doubled. Hospital spending, which is only 48% of total health care spending, accounts for 60% of the increase. If you consider this kind of growth unsustainable, join the club.

The nation's still sharply divided over President Barack Obama's health care law and none of this posturing has cut so much as a cent from costs, and communities that lean heavily on their hospitals will bear the brunt of it. Pittsburgh knows this too well already; a University of Pittsburgh Medical Center hospital in its Braddock neighborhood was closed just last year.


Elko, Nev.
Unemployment rate: 7.9%
Largest employers: Barrick and Newmont mining companies

Is there a pot of gold on the Elko, Nev. horizon?
Photo: iStockphoto

We recently mentioned little Elko and its population of less than 20,000 as an example of a town whose one biggest asset -- the gold it's sitting on -- got it through the recession. While that precious commodity has kept Elko's unemployment rate at roughly half that of Nevada as a whole, it's also a volatile and finite resource than takes as much as it gives.

Gold's trading at roughly $1,490 an ounce, which is a whole lot better than the $561.50 it was fetching five years ago, but well down from a high of nearly $1,565 per ounce in April. Unfortunately for gold and, eventually, for Elko, a good economy is bad for gold prices.

Few places know this better than Elko, where plummeting gold prices dropped to less than $265 per ounce between 1999 and 2001 and forced the mining companies to cut back on jobs and the city to cut back on services.

"Gold is a boom and bust industry," Curtis Calder, Elko's city manager, told Fortune in 2009. "When the rest of the economy drops, the price of gold goes up. We're pretty vibrant right now."

That's the best advice a boom or bubble town can get: Savor the now.


By Jason Notte, The Street
Jun 2, 2011