Sunday, December 22, 2013

ALI and inverted head and shoulder 12-23-2013


ALI's inverter head and shoulder projected a short term target of around 23.50-23.8, and it stopped at 23.70. It also held support with the 52 week low.

A good bounce should happen/has happened to the downtrend resistance around 26.5

In terms of window dressing, I am hoping ALI could easily hit around 26.00-26.50 WITHOUT a breakout.

Then next year, nobody knows, since U.S. is extending its gains probably until next year, hopefully a good bounce/breakout in almost all our bluechip stocks before the expected carnage around Jan-Mar 2014(Primary Wave IV of the U.S).

Thursday, December 19, 2013

HK market. such an upset 12-20-2013


It was such an upset that after having a good uptrend support from June to Dec2013. It unexpectedly fell off and broke down the uptrend channel even though US is having a good year.

It also gone below and had a false breakout to the 2010 to 2013 downtrend channel.(IN DARK RED)

At P/E of 10x, this should be competitive to the Equity prices in US and EU. But it can hardly get up.

Immediate support at 22500 (November lows).

With a target downside of 21,300 to 22,150.

4.5year uptrend support is at 20,850.

DOW hits all time high, SPX did not 12-20-2013


DOW managed to visit fresh all time high and is around the resistance area of 2000 and 2007 peak.

SPX did not made it to the new high.

In Elliot Wave analysis, an overlap to a high or to a low is important to know the next trend.

We indicated last week that it had an overlap to the downside that gave us hint an 80% downtrend coming, but it reversed into upside and broke all resistance, and now hitting and having an overlap to all time high. I guess market is very unpredictable nowadays.

Even our other Elliotisticians are having a hard time and change count each and every day.

SPX already gained 27% for 2013. It's the highest gain of a year for 20th century! Yes that's right. I am not an anti bull market, but events like these cause massive volatility in the future.

Will be posting in the next few days if we have a clearer picture if we are extending again before the much awaited Primary Wave 4. tsk tsk...

Wednesday, December 18, 2013

S&P500 (SPX) status and forecast 12-19-2013


S&P500(SPX) opened higher and went above +1.66% after FED started a minimal taper with 10B less bond buying program to 75B next month.

We are still in a confused market, nowhere to go.

The market didn't touch the all time high which makes the market probably NOT yet extending. 50-50 chance again...

a. If the market moves upward above 1813. We will change the recent low to int wave ii of minor wave 4 of major wave 5. (50%)

b. We continue to see this market as probably the int wave b high before an int wave c low. If we see the market get below 1777 again. We can clearly state that this close at 1810 today is just the int wave b. (50% chance)

Market is so unpredictable. Yet people expecting a Santa Claus rally to finish the year :)

Sunday, December 15, 2013

S&P500 analysis and forecast 12-16-2013


SPX broke an important Elliot Wave rule, which was not to overlap any waves in conjunction to its trend.

We labeled Int Wave iii (1777 SPX) the possible Major Wave 5 component since Aug2013 rally. Just last Thurs and Fri, SPX broke below intraday to as low as 1772.

80% of the time, if Elliot Wave rule is broken, we immediately change count or reversal happens soon. In some cases an overlap is OK but must not exceed a very huge amount of margin.

Weeks ago, we posted that length of Primary Wave I(2009-2011) rally will be EQUAL to Primary Wave III(2011-2013) rally. If worst is to worst happens, we can clearly see that even TIME gives an enormous amount of data to us, and hints us on possible reversals.

SPX also broke below its 1794 short term uptrend line, and next uptrend line is at 1750 to 1752. Europe also has the same charts, and the impulsive selling could be tentatively indicated as Int Wave A, a possible Int Wave B rally could be happening this week before a final Int Wave C to happen to finish MAJOR WAVE A of Primary Wave IV correction. (80% chance to happen)

OR correction is done and we continue to rally to new highs till end of year (20% to happen)


 SPX Weekly Charts also show that MACD and RSI levels are in the outmost part of where market peaks can be found.

We are also in the upper uptrend chancel of bull market since 2009.

We can climb up inch by inch, but who wants to buy and hold in upper resistance channels? :)

Good luck and hope to have a Santa Claus play by end of year :)

Thursday, December 12, 2013

PSEi looks very weak 12-13-13

PSEi now at 5713 (as of 10:14am). Triple dip is in formation, need to hold around 5600-5700 level. But buyers are nowhere to be found??!?!?!

No one is supporting the index with huge bids. What if sellers came by this afternoon?

Have a gut feeling that we will break down soon to reach 5400( 4.5yr uptrend line)- the very last defense. Ceveat !

Please help support the markets! Nobody wants to see PSEi being classified under Bear Market.

Wednesday, December 11, 2013

CRITICAL CRITICAL supports for MBT, BDO and SMPH 12-12-13

CRITICAL CRITICAL supports for MBT, BDO and SMPH.
Must not fall below the following Long term uptrend supports:
MBT - 68.40-70
BDO - 69.0 ( a fall back to 52week low of 66 is not considered at this moment)
SMPH - 15.0

Monday, December 9, 2013

PSEi, close to losing almost all it's gain from Aug2013 low 12-10-2013

PSEi lost 105pts as of 2:34pm SGT. PSEi index at 5903.

Just last week, we concluded that there could be a possible alternate downtrend resistance near 6260 and could knock our index again to a down trend. I did not expect that in a matter of a week, we could lose all the gains from Aug2013 low.

Our initial support is 5950, and at the most 5930. But seems market is too weak even though many buyers are already supporting BDO and MBT at their critical supports.

If the selling persists, we may see a triple bottom at 5700-5800.

Worst is to worst if the triple bottom do not hold. 5400-5500 is the LAST 4.5yr uptrend support to still classify PSEi as a Bullish Market.

If we fall below 5400. Need to bring out my WHITE FLAG..

USD index and all other currencies getting stronger 12-10-13


USD index fell short from the black uptrend line, we have an alternative pink uptrend line for USD to hold into.

Long term, USD index is in a contracting triangle, and the short term weakness makes PHP, KRW, CNY and other foreign currency stronger, it even made EUR reach 1.37xx, its 52week high.

We see USD index have limited downside(assuming tapering is light), 50% uptrend, 50% downtrend. For now, we can see it do a sideways pattern with a more biased to DOWN.

PHP may hit around 44-44.40 if USD index continuous to weaken, and the much anticipated rally of the PHP due to OFW inflows could be less felt this year.

Thursday, December 5, 2013

BDO complete analysis and play/plan 12-6-2013


BDO was the 2nd most defensive/lowest decline banking stock in PSEi.

We determined last June that 66-70 was a buy for the reason of its 4.5 uptrend line support. BDO's chart is easy to read and I can conclude that BDO is still in a Bull market.

Short term support: 72.50(1month low)

Medium/Long term support: 68-70 (4.5yr uptrend should hold into these levels and not the 66.0 52week low we saw last Aug2013.

Play/Plan: Accumulate near 68-70 and a quick short bounce to 76 level (highly probable). Next resistance area is around 81-83 and a strong resistance and could be a selling point. A break below 66-70 could trigger end of bull.

RSI: 36
P/E ratio: 12x (bloomberg, average)

38.2% retracement of bull market: 70.0
50% retracement of bull market: 60.0
2013 high: 99.0
current retracement:  27% from the top

MBT complete analysis and play 12-6-2013


MBT looks weak after it broke down 90 price.

The reason that it sold off until 70 level was that they see the DARK RED color as an uptrend support for the 4.5yr uptrend and they took it as a Bearish sign, but upon looking closely, I can give an alternative uptrend support around 69-72 to still include it as a long term Bullish stock.

Short term support: 73.5( as the 52 week low)

Medium term support: 70-72

Long term support: 69-70

Play/Plan: MBT might go around the 69-72 area, and is a good buy once support is established, and a breakout above the 78 level(downtrend resistance since May2013 top) could trigger a good rally to around 84-90 short to medium term. A fall below 69 level is a Bearish reaction.

RSI: 34
P/E ratio: 9x (bloomberg, relatively cheap)
61.8% retracement of the entire bull market: 65.0
2013 High: 139.50
Current retracement from top: 53.8%

Wednesday, December 4, 2013

SPX, Germany, France, China, HK, Indonesia snapshots 12-5-2013


Monday, December 2, 2013

SPX update and forecast 12-3-2013


SPX lost 4.9 pts last night, and closed at 1800. Some reasons that a quick/long correction should be happening at this level:

1. 1802-1812 is the area of the 1.618% projection of Wave 1.
2. 1812 is also the area of the upper resistance of the entire 4.5year bull market
3. Negative divergence on MACD and RSI on the daily charts.
4. Primary Wave I length in terms of time is nearing to be EQUAL to current's Primary Wave III. which will expire around this month to next month. (It's just a fun fact to match time equality, but sometimes it is a good indicator as well)

Upon counting waves, we can also clearly see 5 minor waves topping out soon, topping out Primary Wave III, or Major Wave 3 or even to as small as Int Wave iii

Forecast is still same as last week:

50% chance - 3-5% correction within Dec, then Xmas rally till end of year to early next year to finish Primary Wave III before a 10-20% drop. (SPX must not close below 1777 for this to happen)

30% chance - we have found the peak of this year, and correction for Primary Wave IV started last night.

20% chance - last night's correction was enough to extend another rally till end of year. (too bullish)( will happen once we get another all time high this week)


Sunday, December 1, 2013

PSEi mid day update 12-2-2013


PSEi went above 6200 resistance and reached 6260 intra day, but closed near 6200 at 12noon. if PSEi goes above 6200, we see still see an alternative downward resistance at 6260.

Market is a bit tricky, market must go above 6200 and 6260 , before we can declare that short term downtrend probably is over - and could be going to a sideways to up pattern or sideways pattern.

If PSEi resumes its downtrend:
1st support 5950
2nd support 5700-5800

AORD, ASX200, possibly broke down on its medium term uptrend 12-2-2013

ASX200 (AU index, ^AORD) possibly broke down today on its medium term uptrend since June 2013 rally.

The index is -0.80% as of 1030am SGT 12/2/2013 and broke below the uptrend support at 5300.

We are looking looking another alternative uptrend support form July 2013, which is around 5240. If it hold from this level, we may re confirm the current trend.

TEL possibly forming a short term bottom 11-29-2013

TEL bottomed short term after hitting 2572. Bought a few shares near 2582 and is expected to reach 2700 level.

TEL recently broke down from 2700 level and now became a resistance, if TEL manage to get up to above 2700, we may see it reach up to 2750-2790 until end of year.

PSEi manage to get up by few hundred points with the help of overbought rallies of TEL,MBT,BDO, SM and others.

PSEi resistance is now at 6,200, where it broke down recently.
6200 resistance :
- where it broke down
- downtrend line since end of Oct
- 50% retracement of Nov 18 peak before it went down near 59xx level.

Thursday, November 28, 2013

TEL and PSEi update, near resistance levels, make or resume downtrend 11-29-2013

TEL bottomed short term after hitting 2572. Bought a few shares near 2582 and is expected to reach 2700 level.

TEL recently broke down from 2700 level and now became a resistance, if TEL manage to get up to above 2700, we may see it reach up to 2750-2790 until end of year.

PSEi manage to get up by few hundred points with the help of overbought rallies of TEL,MBT,BDO, SM and others.

PSEi resistance is now at 6,200, where it broke down recently.
6200 resistance :
- where it broke down
- downtrend line since end of Oct
- 50% retracement of Nov 18 peak before it went down near 59xx level.

Tuesday, November 26, 2013

SPX update 11-27-2013


SPX made another all time high, touched 1808 and closed at 1802.

This 1802-1810 resistance could be very strong in the coming days/weeks to come, US equities already increased by 30% by this year only, all are expecting a Santa Claus rally, but the YTD is yelling that it may have been too much.

Charts are currently hard to predict, but I guess, a quick pullback should happen 3-5% before any new highs for the year. (50%)

or Primary Wave III must end this year and a sizable amount of correction will end this 2013 (30%)

or we breakout at this point without anyone expecting its coming and make new highs for the year and finish Prim Wave III or Major Wave III by January 2014 (20%)


Monday, November 25, 2013

MWC broke down as well :( 11-26-2013

MWC broke below its 4.5yr uptrend(25.0), its now trading way below the support, now at 22.9, its hard to believe that most bluechips stocks are 'technically' becoming into bear market, and supports are below:

21.5 - 61.8% retracement of the entire 4.5yr bull market
19.0-20.0 - technical 2008 and 2011 top

Sad to believe that day by day, an important component of PSEi is deteriorating..

FLI broke down and TEL very much in focus 11-25-2013

Filinvest Land(FLI) most probably broke down below its 4.5yr uptrend (1.40). - Need to be confirmed in the following days to come

TEL is also looking to break below its descending triangle and had a 52week intra day low at 2658

TEL confirmed breakdown 11-25-2013

TEL confirmed breakdown. Short Term Trend: From sideways to downtrend, target downside is near 2500-2550.

Technically speaking, this descending triangle breakdown could trigger selloff up to 2420. Due to the length target of the descending triangle.

PSEi index could face more downside due to Tel's weakness. RSI now at 25.

Long term support still uptrend at 2200. But Medium term support from 2011-2013 has broken down and became sideways to down.

Short term supports: 2500-2550
Medium term supports: 2400-2500
Long Term supports: 2200

Wednesday, November 20, 2013

PSEi breaking down and MBT FGEN looking bad 11-21-2013


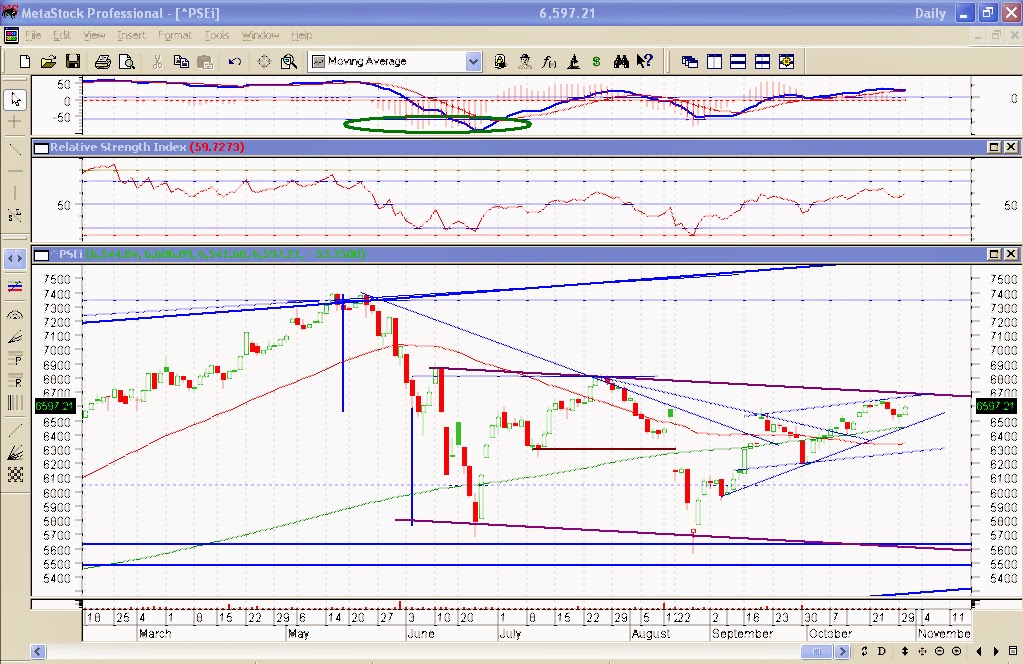
PSEi fell off a very important support(6200). Intra day it held above 6200 but sank down in the afternoon trading closing at 6150 - a clear indication that PSEi broke down again its important support.

Typhoon Yolanda destruction is one of the reason that sparked the selloff, but looking into our neighboring countries in Asia, Jakarta and Thailand - most of the top 5 countries that led the best for 2012 YTD, are almost -20% for the year. Completely the other way around against Germany and SPX at an estimate of +20% YTD.

Mid 2013, we have already plotted the sideways to down pattern for PSEi (dark red), and we still traded with high risk on selective stocks, I myself got stock on some of the stocks which made me think that, in this kind of market, investing in Equity Funds is better and has a lower risk.

Now that an inverted head and shoulder could have been triggered, a target of 5700 is in place, very far from our current index price right now. (50% chance).

Short term support is at 5950-6000 then to our 52week low near 5600-5700.

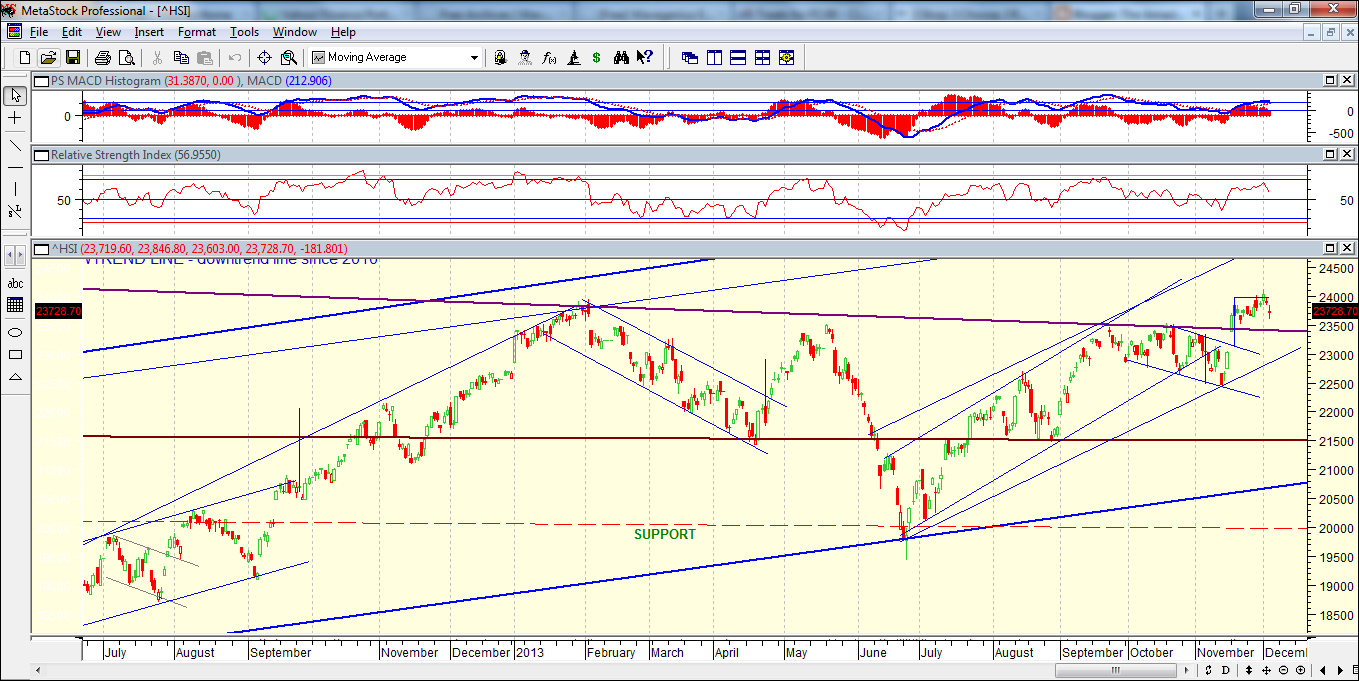
What I am scared of is that our PSEi index is still tagged in a Bull Market, for the reason of holding to its 4.5yr uptrend support sitting nearly at 5340. BUT, BUT, some blue chips hardly cannot rise and broke below their 4.5yr Bull Market channels, namely MBT FGEN LPZ and so on. Which could lead to new 52week lows in the coming weeks/months to come. Other bluechips analysis to follow..

Portfolio: 60% Equity - 40% Cash


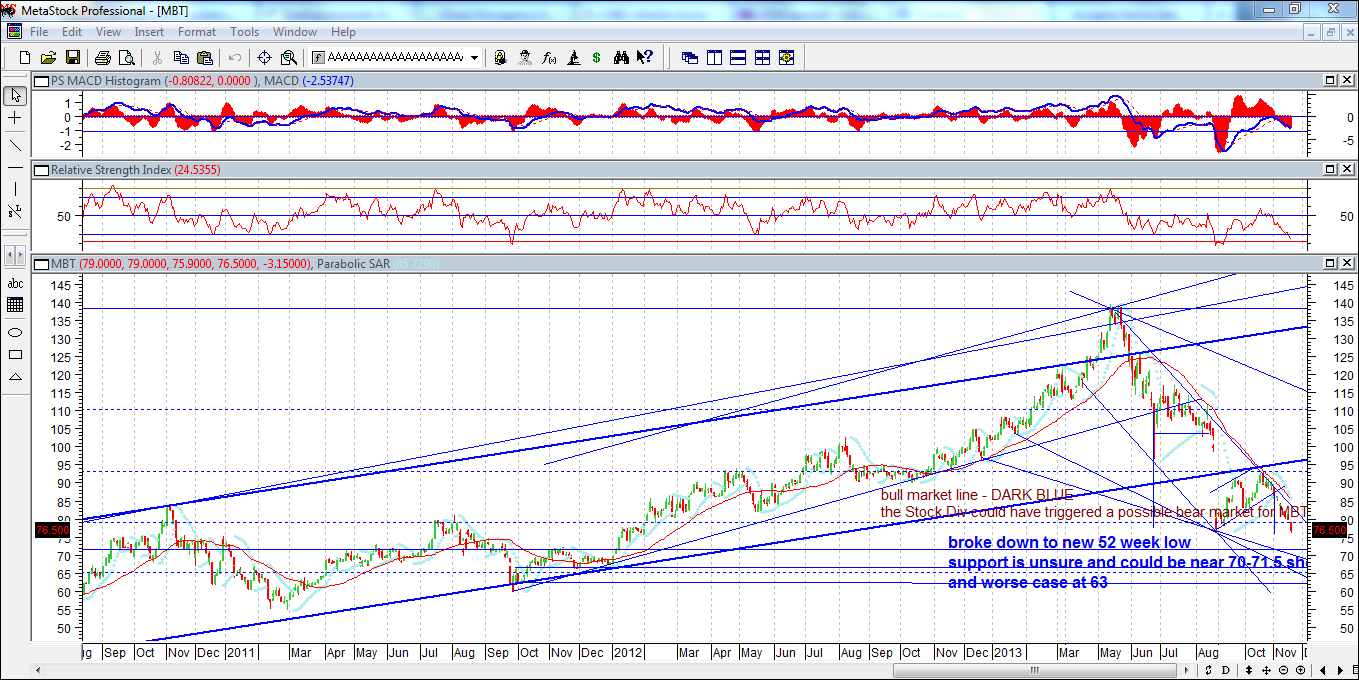
MBT - the first bluechip bank to fell off its important 4.5year uptrend, the stock dividend must be blamed for what has happened to this stock. Although fundamentally speaking, it might still be strong even after giving 30% stock dividend. In technical terms, a breakdown is a breakdown.

Attached above the chart of MBT, and dark blue channel I draw are usually the 4.5year uptrend lines, day by day, I see stocks break below their important uptrend lines causing more selloffs in the market.

I was catching MBT near 80 for the reason that a small uptrend channel is looking good, days later, it fell off easily and expected that 75.5 to 76.5 is a good support.

Today, 11/21/2013 AM trading, it fell off to a new 52week low. really very bad with a good fundamental of P/E 8.0

I really feel that no one(Local or Foreign) that supports these stocks which are in critical conditions. Sorry to say but these kinds of observations happen during a "Bear Market", letting stocks break below easily and reach 52 week lows.

Short term support at 70-71.5, and worse scenario at 63. (31.8% retracement of the entire 2009-2013 bull market)


FGEN and FPH blew up when typhoon Yolanda affected middle portion of the Philippines, bringing electrical posts down around the region.

FGEN was one of my best bet on range trades as it succeeded holding on to its 4.5year uptrend support last May 2013 and bounces from 16 to 19.

But recently, the storm killed this stock, making it clearly break down and fall into Bear Market territory. Freefall was seen from 16 to 13 in a matter of days and it is now trading at 12.xx

I cant believe that its running low (71.8% retracement of entire 2009-2013 bull market), no one knows when the freefall will stock, I also bought some of this around 13-13.5 for the reason that magnitude of breakdown is near that area, but seems that no support/buyer is willing to hold them, so I need to downgrade the support near 11 to 12.50 (very very near to its all time low at 9.xx)

Elliot Wave analysis shows that FGEN could be in a Major Wave 3 selloff of Primary Wave C bear market, and Major 4 and Major 5 upcoming before it can possibly bottom in a new low or in a flat pattern.

Lopez stocks ran out of steam

Some stocks unexpectedly broke down below its 4.5yr uptrend and entered Bear market:
FGEN - when it broke below 16.00
FPH -when it broke below 76

Other non-Lopez stocks are looking to break below their 4.5yr support as well. Making the market very weak and prone to a possible new low..

Will post more analysis soon..

Thursday, November 14, 2013

SPX complete analysis of daily and weekly charts 11-15-2013


US stock market has extended quite very well, with interest rates in the U.S. went near 2.80% level again for 10yr bonds, investors are now really challenging the tapering of the FED in the near term, that is expected to lower bond buying programs or even stop them for a period of time.

Most analysts forecast a rate of 3-3.5% 10yr bonds on 2014, and increase is bonds will further weaken equity and will make 10yr bonds below PAR.

Technically and theoretically speaking, we could be in the upper resistances and could top soon. Three major indicators, which are generally effective 70-80% of the time, are already shouting that a possible correction is due soon. The only reason and the tricky part of all is that, we are still making newall time highs, and whoever institution is doing it, is making the public investments get wary, chase the market and then Kaboom, public investors are trapped and institution making lots of money. The typical emotional trap in a Bull Market.

First and very important indicator: The parallel lines of our entire 4.5 year bull market. SPX/GSPC is pointing to a very strong resistance near 1800-1822. Merely 10pts from where we are right now. This indicator or technique is widely used by any technical analyst or even noob investors, it is widely used in stock as well.

Second indicator: Weekly charts in SPX is pointing a triple negative divergence on the RSI.

Last and theoretical indicator: Elliot Wave Analysis. The market and the investment firms are very good in populating and trading the US markets, every time we call a possible peak, it overextends, making us chase the market again and again. And like what happened in the Philippines and Indonesia Markets, nobody expected it and people are busy counting they enormous gains throughout the day without thinking that market has been exhausted already.

Elliot Wave count suggest 3 scenario:

1. We are in the final waves of intermediate wave v of Major wave 5 of Primary Wave III Bull Market. Next is Primary Wave IV correction which could be 8-20% (50%)

2. We are in the final wave of intermediate wave v of of Major Wave 3 of Primary Wave III Bull Market. Next is Major Wave 4 which could be around 5-8% (30%)

3. Lastly, the smallest chance but fooled us twice already for the past 6months, is an over extending again of intermediate wave v and extending another 5 waves which could run into early January (20%)


Another indicator we usually check is the timeframe of waves.

Sometimes it is just for fun,but sometimes time relation is also important.

SPX weekly charts above shown have green lines.

First green line is the 2009 bottom until Primary Wave I peak around March 2011.

Second green line is the bottom of Primary Wave II until a possible Primary Wave III peak.

Primary Wave III is usually the longest of all,but can be 1:1 ratio with Primary Wave I.

At the end of the month, we could finally find out what is in for us. Good luck to everyone! 


Sunday, November 3, 2013

SPX update, Germany, HK, PH and Indonesia 11-4-2013


Sorry for not posting any update for the past 2-3months, quite busy doing errands. :)

To recap what happened in the past few weeks, U.S. made new highs after resuming work on Government Shutdown and moving the deadline of debt ceiling to Jan-Feb of next year. Our target correction of double digits(10% or so), was cut into half, and US rallied into new highs. Quite short that we were not able to chase in the gains.

Remember that US companies are earning good amount of money, hitting new all time highs, but the US debt is increasing every second, making some catalyst that may possibly downgrade US govt bonds/debts by early next year. At worst, a US bond/debt default.

Now that Elliot Wave Analysis suggests that US extended its Major Wave 5 of Primary Wave III Bull Market, we should be ending the minor wave 3 or 5 of Major Wave 5. And the double digit correction should be seen soon, to compensate the 20% YTD rally of US Equities for 2013, before rallying into new highs until early to mid next year. US Equities are now at 15-16x, around the historical average. (60% chance to happen)

A possible 3-6% correction could be happening soon before making new highs, and delaying the expected double digit correction by Jan, coinciding the debt ceiling issue (40% chance to happen)

Europe Equities also made 5 year highs, and hitting 70>RSI levels and reaching the upper range of the entire bull market, so there's quite a hint, that a slowdown in rally could be in place very soon.

Asia Equities on the other side, like Jakarta and Philippines are taking time to digest the rally they gained from 2011-early 2013. They are still 10-15% from the top, and are in a sideways pattern. Low volume and low foreign buying left them in a sideways pattern. Their PE is at 20x and 19x respectively, still above average, but GDP are in good shape.


Tuesday, August 27, 2013

BDO, FGEN, FLI, TEL, MBT, MEG, PNB, RCB, SECB, SM and SMPH 8-28-2013


SPX, PSE and Indonesia, weighing the bloodbath 8-27-2013


Over the past few weeks, we are anticipating US correction for a couple of weeks or months. And just around mid August, we have confirmed that we are in a major correction in US, we initially advised people that correction could be as deep as 5-12%, and the 'a' leg has been a massive 5% decline in just less than 2 weeks. Now, we could be in a 'b' wave counter rally before a final 'c' wave decline could end this correction.

Elliot wave suggests that we are already in the Major Wave 4 correction of Primary Wave III. Remember the series of Waves we have (Primary, Major, Intermediate then Minor).

And I am overwhelmed on the outcome of our dotted line few weeks ago, it exactly did happen based on the dotted forecast :) clap clap! But sad to say, I didnt follow myself, and got stuck some of my portfolio, guess need to be confident now with my 5years experience in equities/bonds/stocks etc trading.

After a counter rally to maybe around 1660-1670, and based on the length of wave 'a'. we expect another continuation of selloff that can reach as low as 1540 to 1600. (8-12% from the top).


Talking about ASPAC, selloffs already reach levels to say that we are in the Bear Market territory (20% correction or more). Indonesia tops the selloff in terms of percentage at around 26% as of Aug 27,2013. Thailand ranks 2nd and PH lands at 3rd at 20%.

Last 2 weeks ago, I have posted that double dip to 5800 level raised to 50%, the drop was too fast and our ASPAC neighbors already did a new low, so I can roughly say that a potential new low could be set in PH soon!

Estimating the drop of Indonesia (below charts), which gapped down and killed everybody with another 10% decline from its June lows could also be happening in PH (if PH do not hold on it's June lows)

On the brighter side, we don't expect PSE to get below 5k soon. Here are some of the reasons:
- DOW is expected to end its correction with another 5-7% decline.
- Jakarta is 4-5% from its 4year bull market support
- PH which was the most expensive in Asia back in Q1, was beaten by AU at 22x.
- Good amount of supports around 5400-5600, but may not be too strong.
- Blue chips, mostly banks are near their 4yr bull market support.
- and lastly, PSE's most important 4yr uptrend support is at 5181.

Worst thing to happen in this correction is to be able to meet 5181, no less than that !! else, real bear market starts.

Some stocks that are in a critical stage and must hold into their 4yr uptrend lines support to avoid another set of selloff: BDO (67),PNB(67), MBT(89), FGEN(16), SECB(115) and SM(670).


Sunday, August 11, 2013

bdo, fgen, mbt, meg, pnb, rcb, sm, smph, tel 8-11-2013

 Most banks had a double dip even though reporting good earnings. Chart for PSE looks weak as well and chance of hitting back 5800 level is raised to 50%. Factor of increasing the probability is the reason that US might be heading another correction soon based from its behavior.

Top picks:
- BDO if breaks down to new low, accumulate near 72. MBT and PNB as well if breaks down to new low
- FGEN at 16.xx and SMPH at 14.xx to 15.3
- SM if reaches 700 5-yr support