SPX and Dow Jones have almost the same charts, and by simply looking the individual charts, it MAY have slipped through its important support lines at 1340 and 12700 respectively. I have drawn a GREEN uptrend line to foresee possible supports, and if ever in this coming days SPX and DOW rallied above 1340 and 12700, correction may end asap. Otherwise, a breakdown will happen and cause 2-4% more downside risk.
Furthermore, in case breakdown below levels, we should expect a very strong support near 12250-12500 and 1300-1313 based from Elliot wave structure.
Elliot Wave Wave 4 correction usually stops near Wave 1 rally. And looking at the charts, 12250-12500 and 1300-1313 is in place, that’s the last barrier Markets should hold, else, we may see huge sell-offs going back to Oct 2011 lows.
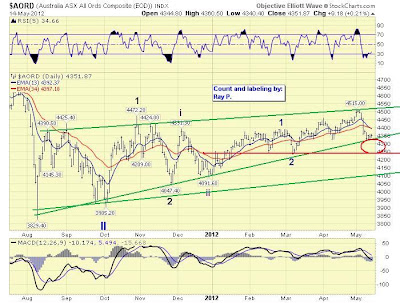
Australia broke its important 10 months uptrend line, and now on a sideways/downtrend pattern. Next support is at 4250, else 4100.
HongKong Markets already slipped almost 10% from its 2012 highs, and still beaten by a mere 3.3% selloff. Making it close at 19259. I lowered the expected 19500 support to 19250, coinciding with today’s close. If tomorrow selloff persist in this market, a deterioration near 18000 is possible. At current 9x P/E, this market should be really attractive in valuation.
In Europe, only Germany is expected to hold into its uptrend cycle, while we expect France and UK to break below its uptrend line, and best advice to be sideways pattern to reflect their 0% QoQ growth for 2012 and Recession for UK.


No comments:
Post a Comment