This is why I love charts!
By combining Elliot Wave Theory and Fibonacci Retracements and Projections, we can clearly dissect down charts and see how emotions could lead to something and how we can forecast and make use of other people's emotions to predict stock market!
Although things might not be in shape yet, I myself is having some technical indicators that bottom for some stocks could be possibly in the works or have bottomed already.
I am anticipating a double digit correction in the U.S. soon, but locally speaking(PSEi)- if and only if U.S. extended its gains in a month maybe, we may see good chance to revisit 6100-6200 first before anything else.
I made below retracement targets of "possible" Primary Wave IV.
The usual sequence: Major wave A, then a rally to Major wave B before a final decline to Major wave C to finish any wave II or IV correction.
Please take a look and share how brilliant charts are and how they are inter related to each others. (These may be just a snapshot of what may happen next, either we have bottomed or continue to go down)
We start with --- C = 0.5 of A (PSEi and LPZ)


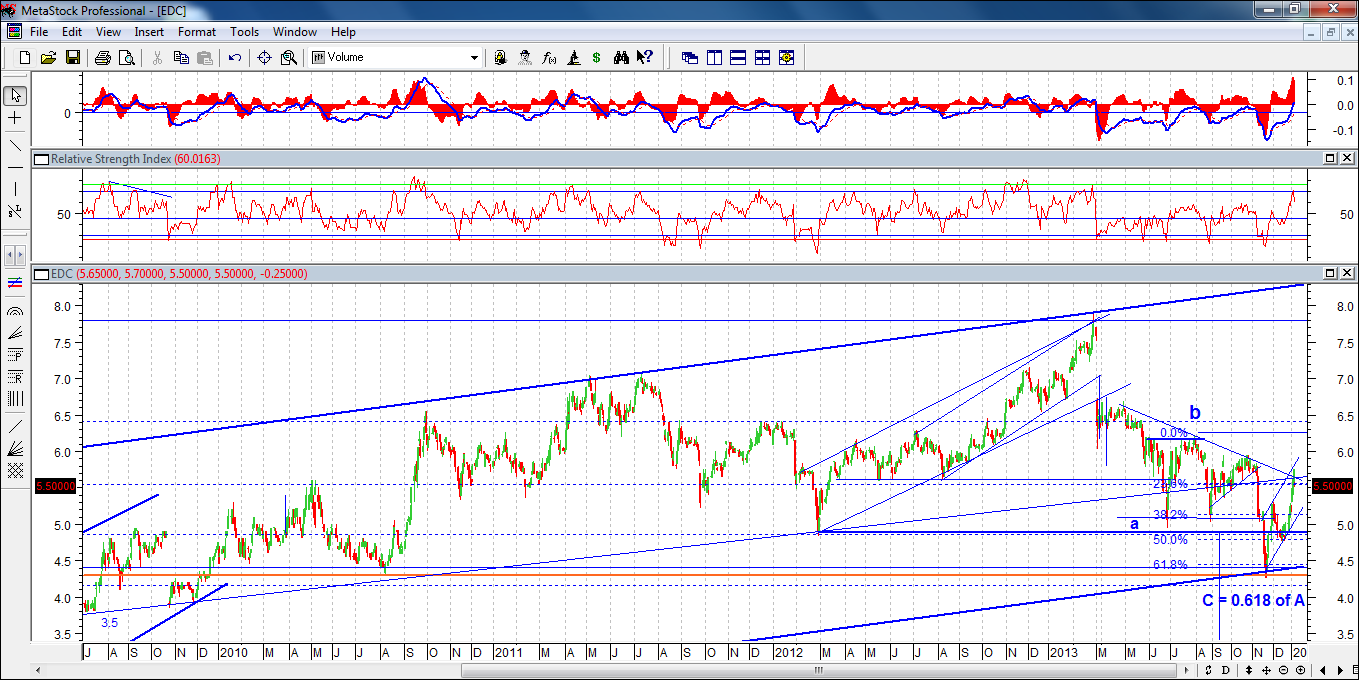
Then we check --- C = 0.618 A ( EDC, FLI and FGEN)


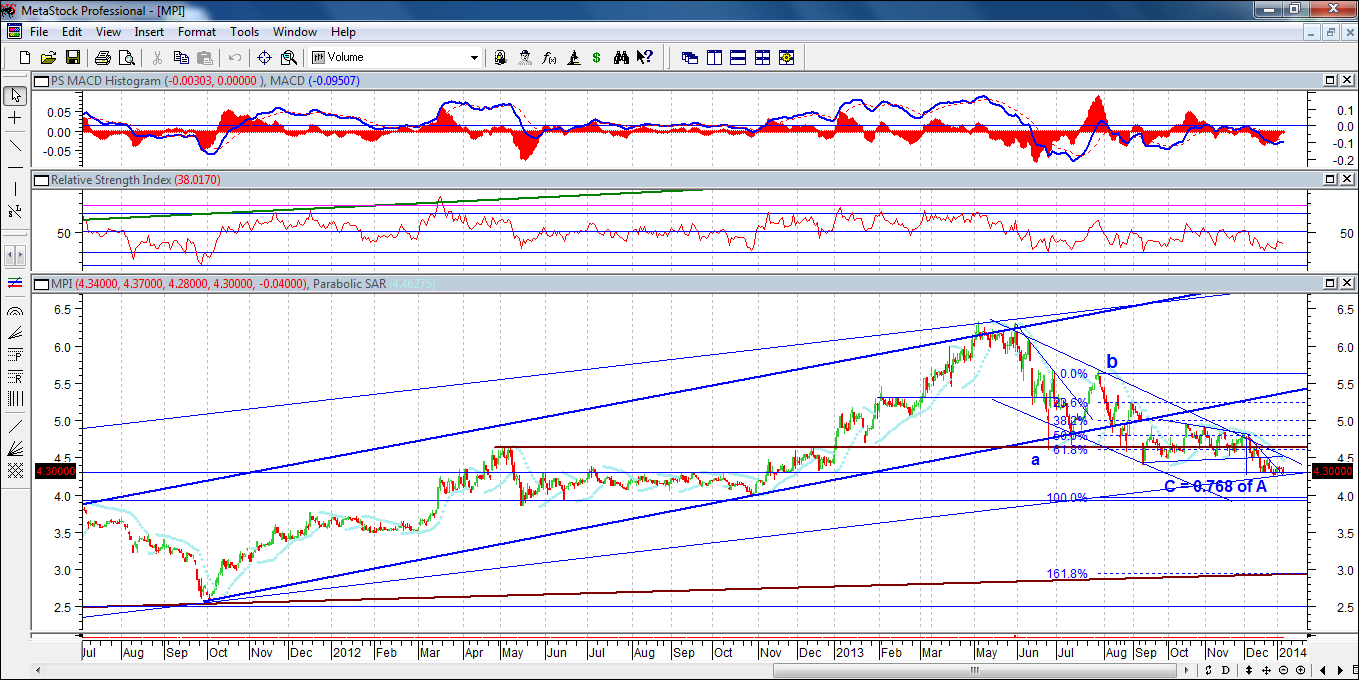
Then --- C = 0.782 of A (TEL, SMPH, MPI, FPH) These level's are already a good starting point to BUY, especially when mini waves have already formed in a 3 or 5 waves down.


Lastly, the one who made many people CRY with impulsive selloffs (MWC), this had a 1:1 correlation and value almost lost half of it's value. Charts looking good! Also is forming a bullish head and shoulder pattern

Fobonacci Retracements:
23.6% - seldom used
38.2%
50%
61.8%
78.6%
100%
161.8% -extremes yet probable during rallies, can also be experienced on selloffs
261.8% -super rare
No comments:
Post a Comment